Camping Market Share Segmentation Bar Graph
RJ0600031_8
- Last Update 06/29/2025
- File Size 14MB
- # of Slides 2
- File Format PPTX
- Slide Ratio 16:9
- Color
Keywords
- #Content-Based Slides
- #Design-Based Slides
- #Market and Competitor Analysis
- #Graph
- #Industry Trends
- #Horizontal Bar
- #Segmented Horizontal Bar
- #16:9
- #stacked bar chart PowerPoint
- #100% segmented chart
- #market share presentation
- #cumulative bar graph slide
- #data visualization template
- #how to create stacked bar chart in PowerPoint
About the Product
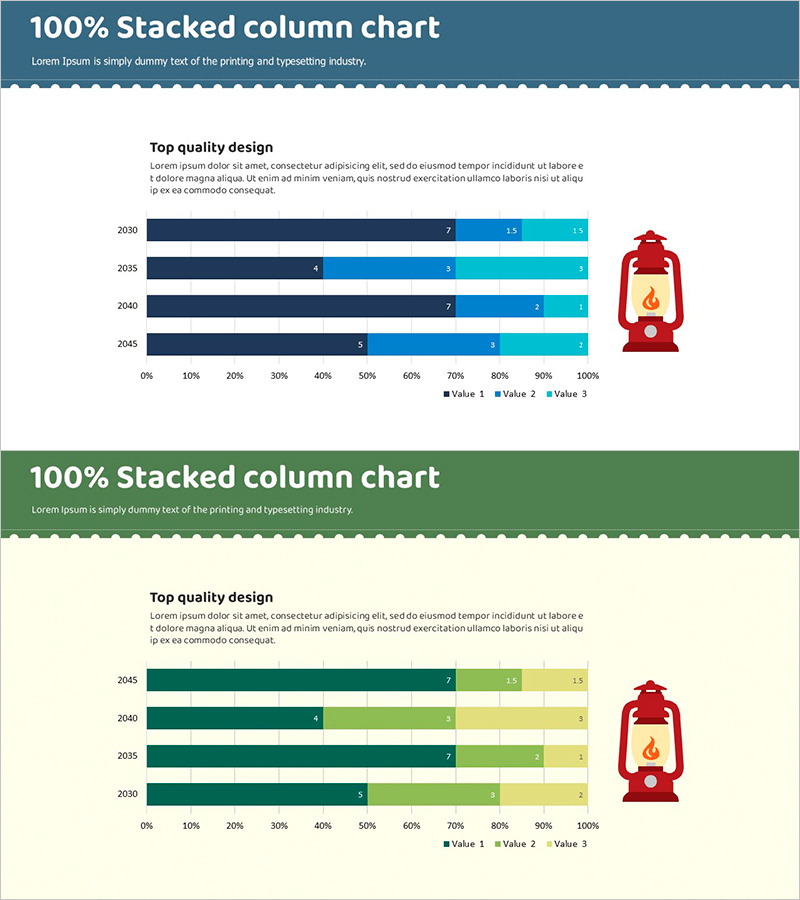
A 100% stacked horizontal bar chart PowerPoint slide designed for camping market analysis and market share comparison. This presentation template visualizes three data categories across four years (2030–2045) as cumulative percentages, clearly showing market composition changes over time. The chart uses a three-color palette—dark blue, light blue, and turquoise—to distinguish each data series, with a 0–100% horizontal axis and year-by-year rows for easy interpretation. Ideal for industry analysis presentations, marketing strategy discussions, investor pitch decks, and business reports where market share trends need clear visual communication. Delivered in 16:9 widescreen PPTX format, fully editable and ready to customize with your data.
Usage Points
-
Main Usage
This chart excels at visualizing market share evolution and category composition ratios within the camping industry. The 100% stacked format simultaneously displays each series' relative weight and position within the total market, making it highly effective for market structure analysis and competitive landscape assessment.
-
How to Use
Deploy this slide when presenting market share findings during strategy planning sessions or investor presentations. The year-over-year progression emphasizes market trends and shifts in category dominance. It fits seamlessly into executive briefings, business plans, annual reports, and competitive analysis sections where data-driven market insights are critical.
-
Recommended For
Marketing managers, business strategists, investment professionals, market analysts, and corporate executives presenting camping industry insights. Particularly valuable for B2B presentations, C-suite reporting, industry research publications, and stakeholder communications where credibility and visual clarity are paramount.
-
Slide Structure
Two-slide set, each featuring an identical 100% stacked horizontal bar chart structure. Four rows represent years (2030, 2035, 2040, 2045), three data series (Value 1, Value 2, Value 3) are color-coded, with a 0–100% horizontal axis scale, legend, and descriptive text area positioned for professional presentation impact.
Related Products
-

Analyzing Flower Horizontal Segmentation Charts – Understanding Market Trends
#Market and Competitor Analysis #Graph #Industry Trends
-

Memorable Travel Destinations Survey Slide – Market and Competitive Analysis
#Market and Competitor Analysis #Graph #Industry Trends
-

Paint Piano and Segmentation Bar Graph – Market Trend Analysis
#Market and Competitor Analysis #Graph #Market Analysis
-

Bar Chart for Eco-friendly Practices Trends Visualization
#Market and Competitor Analysis #Graph #Industry Trends
