Trend of Comparison Items in Line Chart – Emphasizing Market Outlook
RJ0600109_27
- Last Update 07/20/2025
- File Size 0.4MB
- # of Slides 2
- File Format PPTX
- Slide Ratio 16:9
- Color
Keywords
About the Product
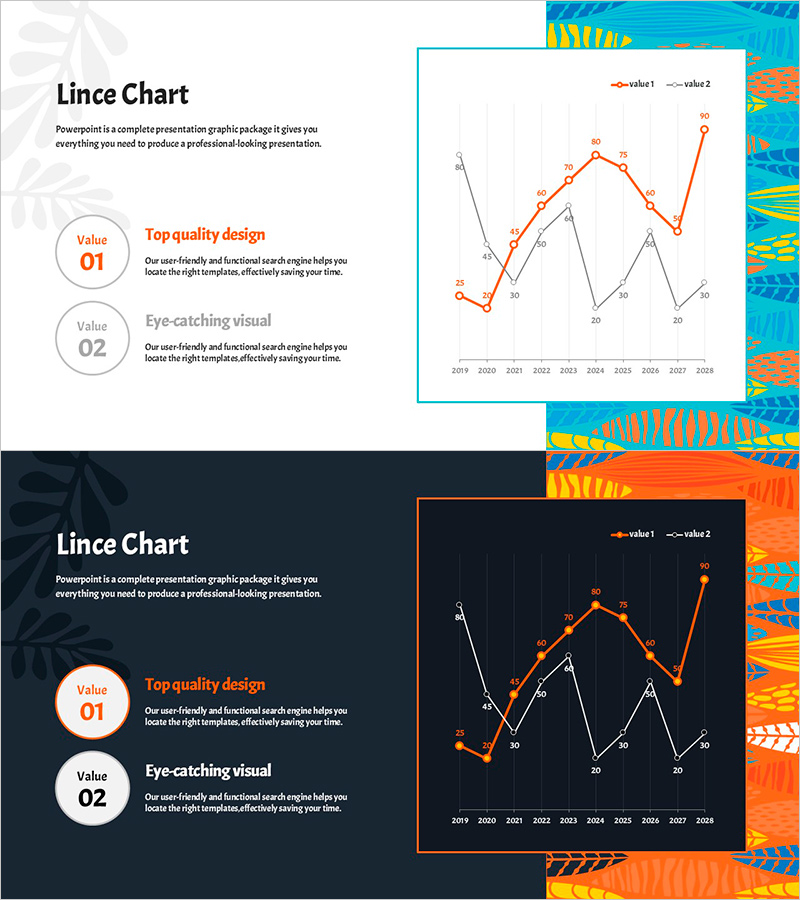
A PowerPoint line chart slide that visualizes the change of two data series over a 10-year period from 2009 to 2028. The orange and gray lines clearly represent comparative trends, with numerical labels at each data point for precise value comparison. Two design versions are provided—light background and dark background—allowing you to choose based on your presentation environment. This slide template is immediately applicable to business presentations including market analysis, competitive benchmarking, performance tracking, and strategic forecasting.
Usage Points
-
Main Usage
Designed to compare and analyze the change trajectories of two items over time simultaneously. Effectively visualizes time-series data such as market growth rates, competitor performance, revenue trends, and customer satisfaction changes, providing clear evidence for strategic decision-making.
-
How to Use
Replace the data points and numerical labels shown on the slide with your actual data values. Line colors (orange and gray) can be customized to match your brand palette, and axis labels and legend text are fully editable. Select either the light or dark background version depending on your presentation environment.
-
Recommended For
Ideal for executive reports, quarterly earnings presentations, market analysis documents, competitive positioning analysis, and future outlook presentations. Recommended for finance teams, marketing departments, strategy teams, sales teams, and any role requiring data-driven decision-making.
-
Slide Structure
2-slide set. Slide 1 features a light background with orange and gray dual-series line chart, 'Value 01' and 'Value 02' text boxes positioned on the left. Slide 2 presents the identical structure with a dark background. Both slides display 10 data points spanning 2009-2028 with numerical labels at each point.
Related Products
-

Comparison Emphasis Line Graph & Explanatory Text – Market Analysis and Competitive Advantage
#Market and Competitor Analysis #Graph #Future Outlook
-

Camping Market Future Outlook Graph
#Market and Competitor Analysis #Graph #Future Outlook
-

Performer and Line Chart – Market Analysis and Future Outlook
#Market and Competitor Analysis #Graph #Future Outlook
-

Analysis of Reading Volume by Data – Market Status and Competitive Advantage
#Market and Competitor Analysis #Diagram #Graph
