Detailed Location Map & Occupancy Graph – Market Share and Global Network
RJ0200012_16
- Last Update 03/31/2025
- File Size 1.6MB
- # of Slides 2
- File Format PPTX
- Slide Ratio 16:9
- Color
Keywords
- #Content-Based Slides
- #Design-Based Slides
- #Company Introduction
- #Market and Competitor Analysis
- #Graph
- #Other
- #Global Network
- #Market Share
- #Circles
- #Pie Chart
- #Map
- #16:9
- #Asia map PowerPoint slide
- #world map presentation template
- #market share pie chart
- #regional analysis slide
- #global network visualization
- #geographic data PowerPoint
- #how to create map slide in PowerPoint
About the Product
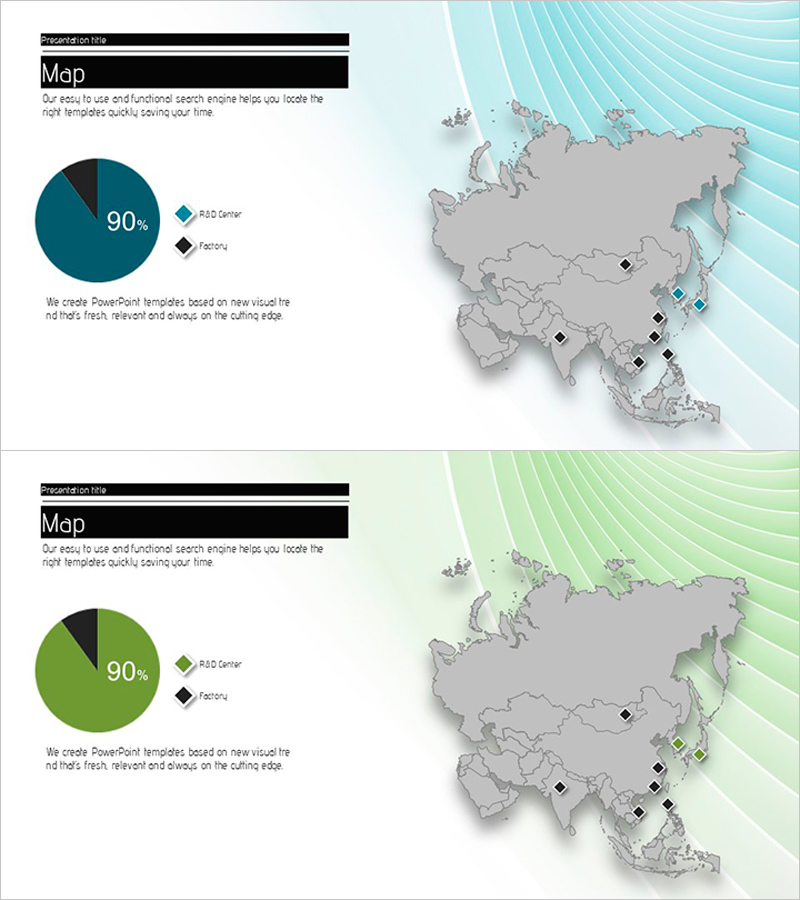
A comprehensive PowerPoint slide set for visualizing global market analysis and regional market share at a glance. Features a 3D map of Asia with location markers and legend indicating R&D centers and factories, combined with a pie chart displaying 90% market share data. The teal and green gradient background creates a professional business presentation aesthetic. The 16:9 widescreen format with 2-slide composition is ready to use for market overview presentations, global network introductions, sales territory explanations, and strategic business communications.
Usage Points
-
Main Usage
Simultaneously present global market conditions and regional market share to support international business strategy presentations. The 3D map with location markers clearly identifies business territories, while the pie chart intuitively conveys numerical data to enhance audience comprehension and decision-making.
-
How to Use
Introduce your global network structure on the first slide using the Asia map and location markers, then explain market share percentages on the second slide using the pie chart. All markers, legend items, and data values are fully editable and can be customized to match your actual business data.
-
Recommended For
Ideal for international sales team market analysis presentations, executive reports on global business locations, investor relations materials highlighting regional performance, and marketing strategy documents analyzing market penetration. Recommended for consulting firms, trading companies, and multinational corporations presenting strategic initiatives.
-
Slide Structure
Slide 1: 3D Asia map + location markers (black and blue diamond icons) + legend (R&D Center, Factory) / Slide 2: Pie chart (90% teal segment + remaining black segment) + legend + descriptive text. Unified background with teal-to-green gradient wave pattern throughout.
Related Products
-

Market Analysis Slide for Major European Exporters
#Company Introduction #Market and Competitor Analysis #Graph
-

Asia Map Presentation Template - Market Share Analysis
#Market and Competitor Analysis #Graph #Other
-

Pie Chart of Camping Business Market Share by European Country
#Market and Competitor Analysis #Graph #Other
-

Global Map and Donut Chart – Visualizing Market Share
#Company Introduction #Market and Competitor Analysis #Graph
