Simple Circle Pie Chart Template - Market Share Analysis
RJ0200013_19
- Last Update 04/01/2025
- File Size 0.4MB
- # of Slides 2
- File Format PPTX
- Slide Ratio 16:9
- Color
Keywords
- #Content-Based Slides
- #Design-Based Slides
- #Market and Competitor Analysis
- #Marketing Plan and Strategy
- #Graph
- #Market Share
- #Target Market Strategy
- #Circles
- #Pie Chart
- #16:9
- #pie chart PowerPoint slide
- #circular graph template
- #market share analysis
- #ratio comparison chart
- #business presentation slides
About the Product
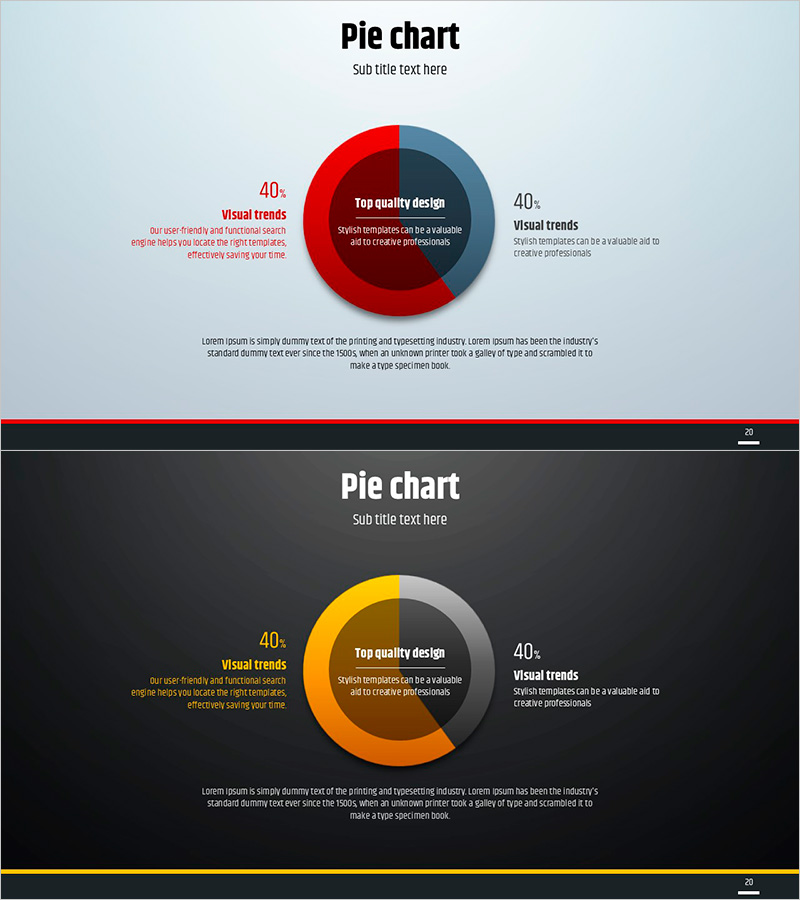
A 2-slide PowerPoint presentation set optimized for market share analysis and ratio comparison. The first slide features a light blue background with red and dark blue two-tone pie chart, while the second slide displays a dark background with yellow and orange two-tone chart. Each slide includes 40% ratio labels and left-right text areas for data explanation, ready for immediate use in marketing strategy, business analysis, and target market presentations. Delivered in 16:9 widescreen PPTX format compatible with all presentation environments.
Usage Points
-
Main Usage
Clearly express the ratio relationship between two items such as market share, revenue proportion, customer composition, or product sales mix using pie chart visualization. Percentage values and legends are displayed together with each segment to support intuitive data interpretation, enabling emphasis of critical ratio information in marketing strategies, business analysis, and management reports.
-
How to Use
Use the light blue background slide for bright conference rooms and online presentations, and the dark background slide for large auditoriums and projector environments. Enter item names, descriptions, and values in the left-right text areas, then edit the pie chart colors and proportions to match your data. The 16:9 format is optimized for modern displays and projectors.
-
Recommended For
Marketing managers, executives, business analysts, and finance professionals presenting market conditions, competitor comparisons, customer segment analysis, and product sales composition. Ideal for quarterly performance reports, investor presentations, strategy meetings, and client proposal presentations where ratio data must be communicated clearly.
-
Slide Structure
2-slide layout with each slide containing a title area, central pie chart (2-segment two-tone color), left 40% text box, right 40% text box, and bottom description text area. The first slide features a light blue background with red and dark blue chart, while the second uses a dark background with yellow and orange chart for visual variety.
Related Products
-

Pie Chart of Composition Ratio by Fashion Type – The Start of Data Visualization
#Company Introduction #Market and Competitor Analysis #Diagram
-

Market Share Analysis with Pie Chart – Precise Data Visualization
#Company Introduction #Market and Competitor Analysis #Graph
-

Camera Pie Chart – Market Share Analysis
#Market and Competitor Analysis #Graph #Other
-

Simple Car Presentation Diagram & Pie Chart – Optimized for Market Analysis
#Market and Competitor Analysis #Diagram #Graph
