Navigation App Competitive Advantage Analysis – Effective Comparison with Data Visualization
RJ0400039_18
- Last Update 05/28/2025
- File Size 0.7MB
- # of Slides 2
- File Format PPTX
- Slide Ratio 16:9
- Color
Keywords
About the Product
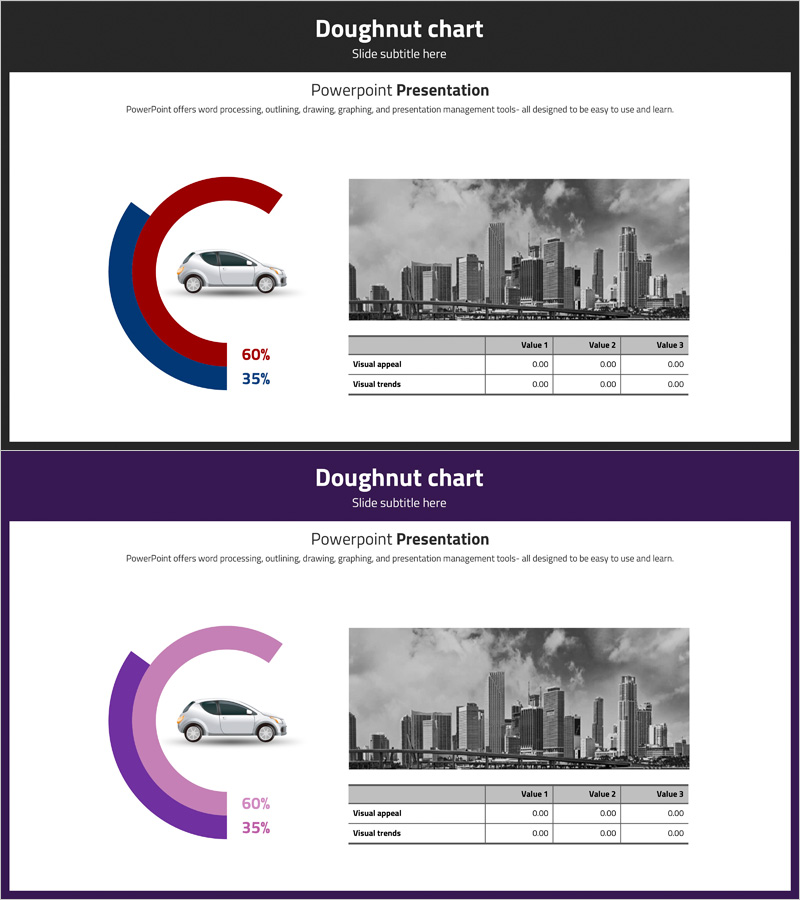
A 2-slide PowerPoint set featuring doughnut charts for data visualization and comparison. Includes two color variations: blue-red and purple-pink designs, each displaying 60% and 35% ratio segments. Each slide combines a doughnut chart with a city photograph and data table, enabling simultaneous presentation of quantitative metrics and contextual information. Ready-to-use for competitive advantage analysis, market share comparison, and product performance evaluation in business presentations.
Usage Points
-
Main Usage
Visualize two key performance indicators side-by-side using doughnut chart segments. Ideal for competitive advantage analysis, market share comparison, product feature performance evaluation, and data-driven decision-making presentations.
-
How to Use
Edit the doughnut chart percentages (60%, 35%) with your own data values. Customize the table labels and numerical entries in the right column. Replace or remove the background cityscape image to match your industry or presentation theme. Choose between blue-red or purple-pink color scheme based on your presentation tone.
-
Recommended For
Marketing professionals presenting market analysis, sales teams comparing competitor positioning, executives reporting performance metrics, product managers analyzing feature comparisons, and consulting firms preparing client proposals.
-
Slide Structure
2-slide layout. Each slide features a 2-segment doughnut chart (60%-35% ratio) on the left, vehicle icon in center, cityscape photograph on the right, and a 3-column data table with Visual appeal and Visual trends rows, plus Value 1, Value 2, Value 3 input fields.
Related Products
-

Current Status Dominance Analysis Chart – Visualizing Competitive Advantage
#Company Introduction #Market and Competitor Analysis #Diagram
-

Key Competitive Factors in Market Analysis – First Step Toward Competitive Advantage
#Market and Competitor Analysis #Diagram #Graph
-

Drug Addiction Risk Analysis Graph Chart – Insightful Information Delivery
#Market and Competitor Analysis #Diagram #Graph
-

Sensuous Doughnut Chart Slide – Market Share Analysis
#Market and Competitor Analysis #Diagram #Graph
