Academic Content Diffusion Overlay Diagram – Product Differentiation Strategy
RJ0500025_22
- Last Update 06/13/2025
- File Size 0.5MB
- # of Slides 2
- File Format PPTX
- Slide Ratio 16:9
- Color
Keywords
- #Content-Based Slides
- #Design-Based Slides
- #Product/Service Introduction
- #Diagram
- #Differentiation Strategy for Products/Services
- #Program Introduction
- #Cluster
- #Spread
- #Combination Diagram
- #Centralized Diagram
- #16:9
- #radial diagram PowerPoint
- #diffusion diagram slide
- #central cluster diagram
- #6-node diagram
- #product differentiation PowerPoint slide
- #business model diagram template
About the Product
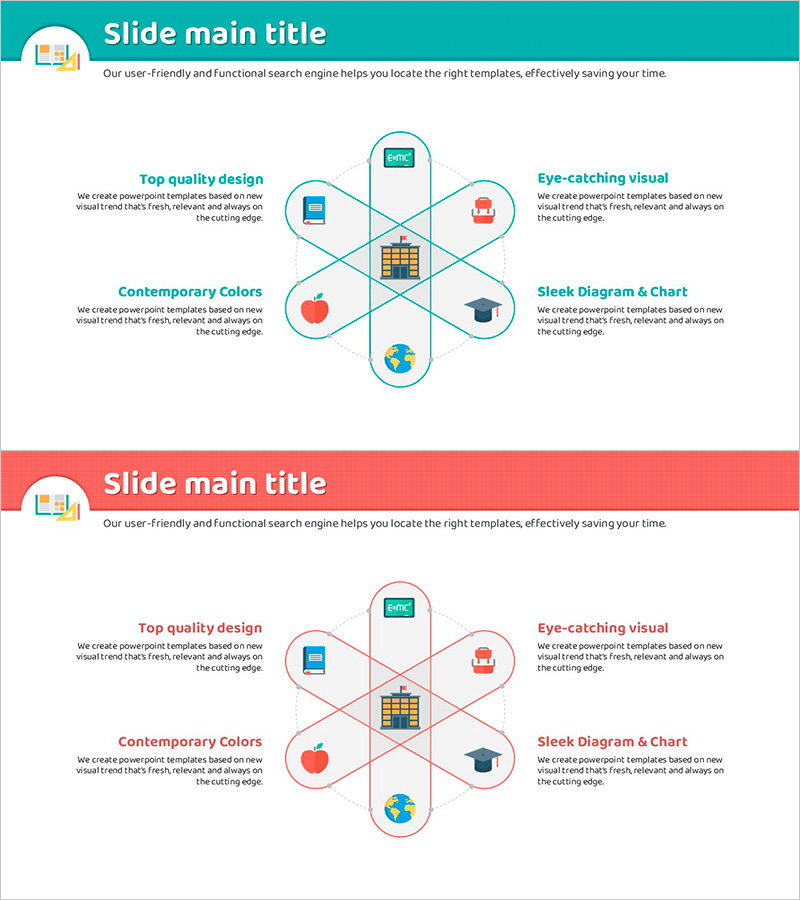
A radial diffusion diagram PowerPoint slide featuring a central concept node with six surrounding nodes radiating outward. Designed in teal and red dual-tone color scheme, each node includes an icon and text description area. This slide template is optimized for presentations that expand from a core concept to multiple peripheral elements, such as product differentiation strategies, business model analysis, and core value dissemination. The 2-slide set offers flexible content combinations and is fully editable in all PowerPoint versions with 16:9 widescreen format in PPTX.
Usage Points
-
Main Usage
Visualizes a structure where a central concept or core value expands into six peripheral elements, strategies, or functions. Effectively communicates product differentiation factors, multiple revenue streams in business models, organizational core competencies, and their applications.
-
How to Use
Enter the core concept (e.g., product name, strategy name) in the central node and add detailed items, features, or benefits to the six outer nodes. Customize icons for each node or adjust colors to emphasize importance. Add animations along the presentation flow for more dynamic delivery.
-
Recommended For
Recommended for product managers, marketing professionals, executive reports, business proposals, and educational seminars. Particularly effective for strategy presentations emphasizing multi-faceted expansion of core concepts, new product introductions, and organizational capability explanations.
-
Slide Structure
2-slide set. Each slide features one central circular node surrounded by six circular nodes in radial arrangement. Connection lines extend from the center outward, with each node containing an icon and text input area. One slide with teal background and one with red background for color variation options.
Related Products
-

Services for the Elderly – Variety of Choices and Visual Trends
#Product/Service Introduction #Diagram #Differentiation Strategy for Products/Services
-

Design Inspiration for Presentation Slide
#Product/Service Introduction #Business Vision and Strategy #Diagram
-

Camping Infographic Nested Diagram – Emphasizing Product/Service Comparison
#Product/Service Introduction #Diagram #Features
-

Differentiation Strategy for Eco-Friendly Business – Real Product/Service Case
#Product/Service Introduction #Diagram #Differentiation Strategy for Products/Services
