Differentiated Promotion Strategy Presentation Template – Emphasizing Marketing and Innovation
RB0800057_9
- Last Update 03/27/2025
- File Size 0.8MB
- # of Slides 2
- File Format PPTX
- Slide Ratio 4:3
- Color
Keywords
- #Content-Based Slides
- #Design-Based Slides
- #Product/Service Introduction
- #Marketing Plan and Strategy
- #Diagram
- #Differentiation Strategy for Products/Services
- #Promotion Strategy
- #Flow
- #Cluster
- #Linear Flow
- #Combination Diagram
- #4:3
- #overlapping circle diagram PowerPoint
- #Venn diagram slide template
- #3-element comparison chart
- #relationship diagram PPT
- #business analysis slide design
About the Product
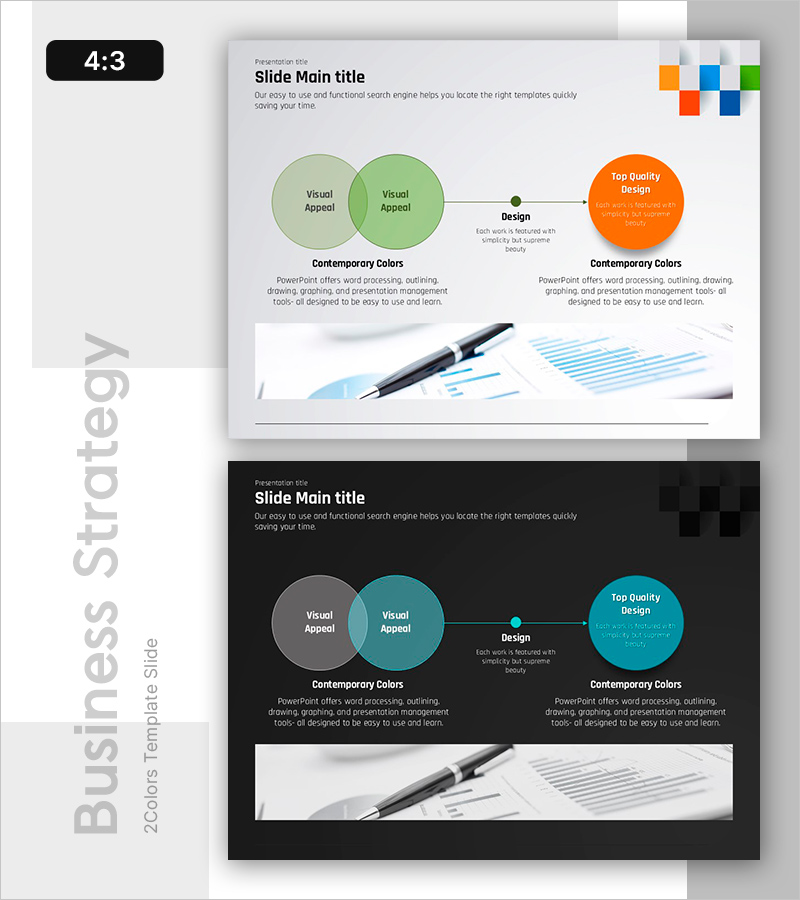
A PowerPoint slide featuring overlapping circle diagrams optimized for visual comparison and relationship mapping. This 2-slide set includes both light and dark color themes, with each slide displaying three intersecting circular nodes and a central connection point to intuitively represent data intersections and interactions. The contrast between orange accent circles and green background circles highlights key elements, while arrows and text areas clearly structure process flows and explanations. Immediately applicable for marketing strategy presentations, product introductions, and business analysis decks.
Usage Points
-
Main Usage
Visually compare and analyze intersections, commonalities, and differences between two or more concepts or datasets. Effective for marketing strategy presentations showing target audience segmentation, product introductions comparing competitors, and business analysis illustrating market divisions.
-
How to Use
Enter comparison subject characteristics or metrics into each circular node, and place shared elements in the overlapping center area. Use arrows and text boxes to add causal relationships or process flows, and adjust colors to emphasize different elements.
-
Recommended For
Marketing professionals, strategy planners, product managers, consultants, and educators who need to communicate comparative analysis results persuasively. Ideal for presentations requiring clear relationship mapping between 2–3 items.
-
Slide Structure
Slide 1 (light theme): White background with two light green circles (left), orange circle (right), black center connection point, four text areas. Slide 2 (dark theme): Black background with gray and teal circles, orange accent circle, identical structure. 4:3 aspect ratio, 2-slide PPTX format.
Related Products
-

Camping Isometric Production and Technology Development Strategy – Innovative Approach
#Product/Service Introduction #Diagram #Product/Service Introduction
-

Modern Business Infographic Slide – Transforming Presentations
#Product/Service Introduction #Business Introduction #Diagram
-

Brain Science Learning Overlapping Diagram – An Innovative Approach to Learning
#Product/Service Introduction #Diagram #Text Box
-

Science Icons Overlay Diagram and Text – Product Differentiation Strategy
#Product/Service Introduction #Diagram #Differentiation Strategy for Products/Services
