Overlap Diagram for Analysis and Strategy – Business Insights
RJ0300027_33
- Last Update 04/25/2025
- File Size 0.4MB
- # of Slides 2
- File Format PPTX
- Slide Ratio 16:9
- Color
Keywords
- #Content-Based Slides
- #Design-Based Slides
- #Product/Service Introduction
- #Business Vision and Strategy
- #Diagram
- #Differentiation Strategy for Products/Services
- #Business Strategy
- #Cluster
- #Combination Diagram
- #16:9
- #overlap diagram PowerPoint
- #Venn diagram slide template
- #intersection analysis PPT
- #business comparison slide
- #two-element diagram presentation
About the Product
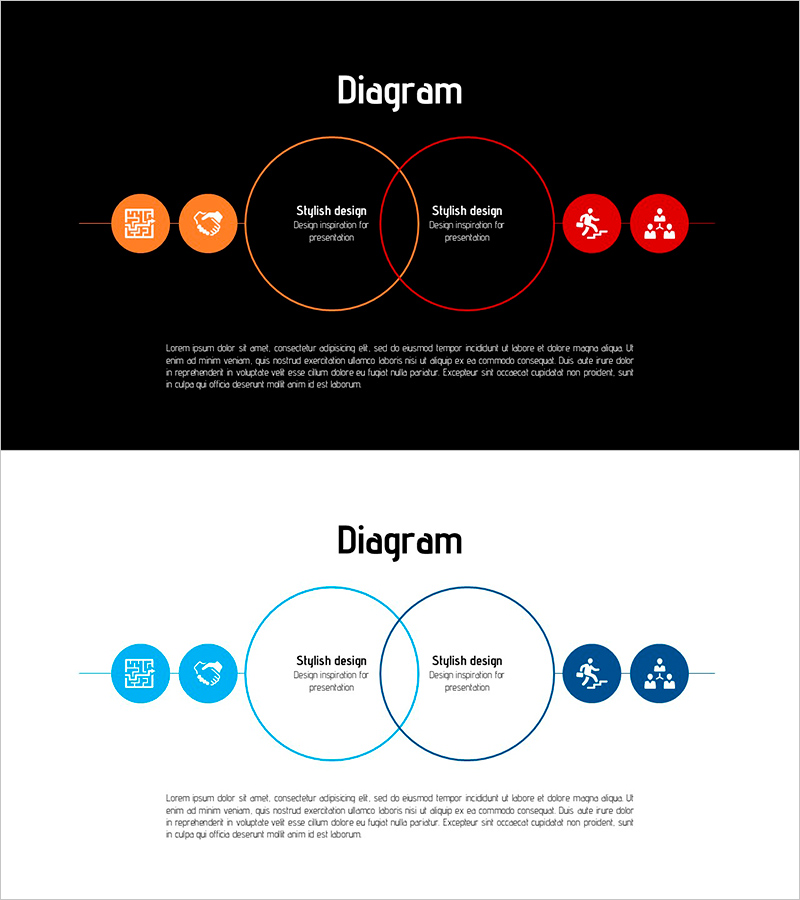
A Venn diagram-style PowerPoint slide featuring two overlapping circles that emphasize the intersection area for comparative analysis. The left circle is orange and the right circle is red, with the overlapping center area designed for shared elements. Four icons are positioned at both ends to visualize characteristics of each section. Against a black background, the high-contrast color scheme maximizes presentation impact and is immediately applicable to business strategy, analytical methodology, and comparative analysis presentations. Available in editable PPTX format with 16:9 aspect ratio across 2 slides.
Usage Points
-
Main Usage
This comparative analysis slide simultaneously expresses commonalities and differences between two concepts, strategies, or methodologies. Place intersection elements in the overlapping area and describe unique characteristics in each circle to emphasize logical structure. Visualizes critical insights for business strategy development, market analysis, organizational role definition, and decision-making processes.
-
How to Use
Enter the first concept (e.g., company strengths) in the left orange circle and the second concept (e.g., market opportunities) in the right red circle. Describe shared elements (e.g., competitive advantage) in the center overlapping area and add detailed items to the icon areas at both ends. Freely edit text, colors, and icons to customize for your presentation context.
-
Recommended For
Executives, strategy teams, marketing professionals, consultants, and educators use this slide when explaining business strategy, market analysis, organizational structure, and process improvement. Particularly effective in business plans, strategy reports, proposals, and educational seminars where clarifying relationships between two elements is essential.
-
Slide Structure
2-slide set. First slide features a black background with orange and red circles intersecting at center, QR code and 2 icons on the left, 2 icons on the right in horizontal alignment, and descriptive text area at bottom. Second slide presents the same structure with blue and dark blue circles on white background, offering color variation options.
Related Products
-

Water Resources Overlapping Diagram Presentation Template
#Product/Service Introduction #Business Vision and Strategy #Diagram
-

Sailing Travel Business Strategy Overlapping Diagram
#Product/Service Introduction #Business Vision and Strategy #Diagram
-

Differentiated Fashion Strategy Slide – Business Vision and Strategy
#Product/Service Introduction #Business Vision and Strategy #Diagram
-

Urban Science Overlay Diagram – Innovative Business Strategy
#Product/Service Introduction #Business Vision and Strategy #Diagram
