Budgeting Planner – Efficient Financial Management
RM0400005_26
- Last Update 02/15/2025
- File Size 2.9MB
- # of Slides 2
- File Format PPTX
- Slide Ratio 16:9
- Color
Keywords
- #Content-Based Slides
- #Design-Based Slides
- #Financial Plans and Performance
- #Diagram
- #Projected Return on Investment (ROI)
- #Budget
- #Table
- #16:9
- #marketing budget PowerPoint slide
- #budget management table template
- #financial data presentation slide
- #how to create a budget table in PowerPoint
- #marketing budget planning deck
About the Product
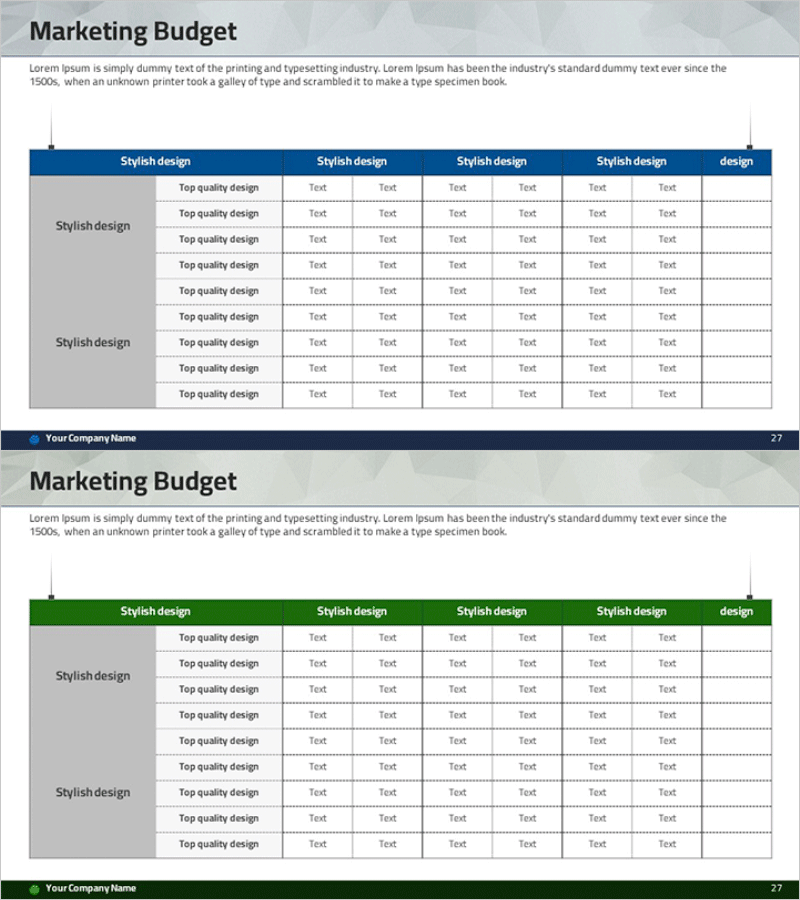
A professional PowerPoint slide designed for presenting marketing budget plans and financial status at a glance. Features a company logo space on the left and a multi-row data table on the right, with blue and green header variations. The table structure includes clearly defined rows and columns with ample text input areas for budget items, amounts, responsible parties, and progress rates. Ideal for business plans, marketing proposals, and investor pitch decks where budget allocation and spending status need clear visualization.
Usage Points
-
Main Usage
Presents marketing department budget allocation, monthly and category-wise spending status, and cost-to-performance tracking in a structured format. The organized table layout enables quick comprehension by decision-makers and ensures transparent budget execution reporting.
-
How to Use
Insert this slide into the budget section of marketing proposals, quarterly business reports, or executive briefing materials. Simply fill in budget line items, allocated amounts, actual spending, remaining balance, and responsible parties into the table cells for an instantly polished presentation.
-
Recommended For
Marketing managers, finance professionals, project managers, and executives presenting budget status. Particularly effective for comparing multi-department budgets, analyzing monthly or quarterly trends, and tracking budget performance across initiatives.
-
Slide Structure
Two-slide set with consistent layout: company logo space on the left (gray background) and data table on the right. Each table contains 5-6 columns and 8-10 rows with blue or green headers, providing clear visual hierarchy for data entry and professional appearance.
Related Products
-

Estimated Fund Requirements for Real Estate Investment Slide – Foundation of Financial Planning
#Financial Plans and Performance #Diagram #Projected Return on Investment (ROI)
-

Expected Return on Investment Chart – Visualizing Financial Performance
#Financial Plans and Performance #Diagram #Projected Return on Investment (ROI)
-

Estimated Fund Requirements for Construction Projects – Clear Financial Planning
#Financial Plans and Performance #Diagram #Projected Return on Investment (ROI)
-

Business Budget Summary Table – Visualizing Financial Plans and Performance
#Financial Plans and Performance #Diagram #Projected Return on Investment (ROI)
