Expected Return on Investment Chart – Visualizing Financial Performance
RM0500005_27
- Last Update 02/21/2025
- File Size 0.2MB
- # of Slides 2
- File Format PPTX
- Slide Ratio 16:9
- Color
Keywords
About the Product
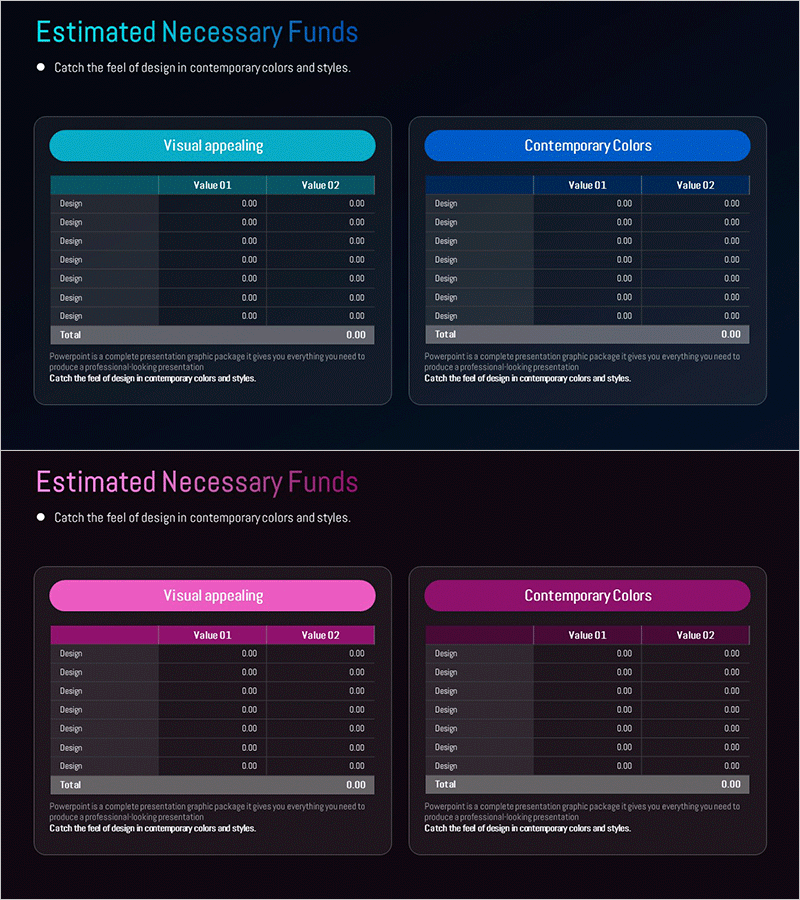
A financial performance visualization slide featuring expected return on investment comparison in table format. Available in two color themes—cyan and magenta—each with Value 01 and Value 02 columns for side-by-side analysis. The structured table layout presents financial metrics, budget figures, and ROI data in a clear, comparable format. Ideal for business plans, investor pitch decks, and financial reports where key performance indicators need immediate visual impact.
Usage Points
-
Main Usage
Compares key financial metrics such as ROI, budget performance, and financial indicators across two scenarios or time periods. Designed to enhance data readability and support executive decision-making with structured numerical comparisons.
-
How to Use
Insert into the financial planning section of business proposals, investor pitch decks, or quarterly financial reports. Replace placeholder values with actual financial data and select the color theme that matches your presentation branding.
-
Recommended For
CFOs, financial analysts, investor relations managers, and executives presenting financial performance. Suitable for startup investment pitches, corporate quarterly earnings presentations, and financial consulting reports.
-
Slide Structure
Includes a title area and two color-themed comparison tables. Each table contains row labels (8 Design rows plus Total) and two data columns (Value 01 and Value 02), with clearly defined input areas for numerical entries.
Related Products
-

Expected Investment Return Calculation Slide
#Financial Plans and Performance #Diagram #Projected Return on Investment (ROI)
-

Medical Business Expected Funding Requirements Table – Efficient Financial Planning
#Financial Plans and Performance #Diagram #Projected Return on Investment (ROI)
-

Marketing Budget Analysis Table – Optimized for Financial Performance
#Financial Plans and Performance #Diagram #Projected Return on Investment (ROI)
-

Business Budget Summary Table – Visualizing Financial Plans and Performance
#Financial Plans and Performance #Diagram #Projected Return on Investment (ROI)
