Marketing Budget Analysis Table – Optimized for Financial Performance
RM0400002_26
- Last Update 02/14/2025
- File Size 1MB
- # of Slides 2
- File Format PPTX
- Slide Ratio 16:9
- Color
Keywords
- #Content-Based Slides
- #Design-Based Slides
- #Financial Plans and Performance
- #Diagram
- #Projected Return on Investment (ROI)
- #Budget
- #Table
- #16:9
- #marketing budget PowerPoint slide
- #budget analysis table presentation
- #financial table slide template
- #marketing budget management PPT
- #budget comparison analysis slide
About the Product
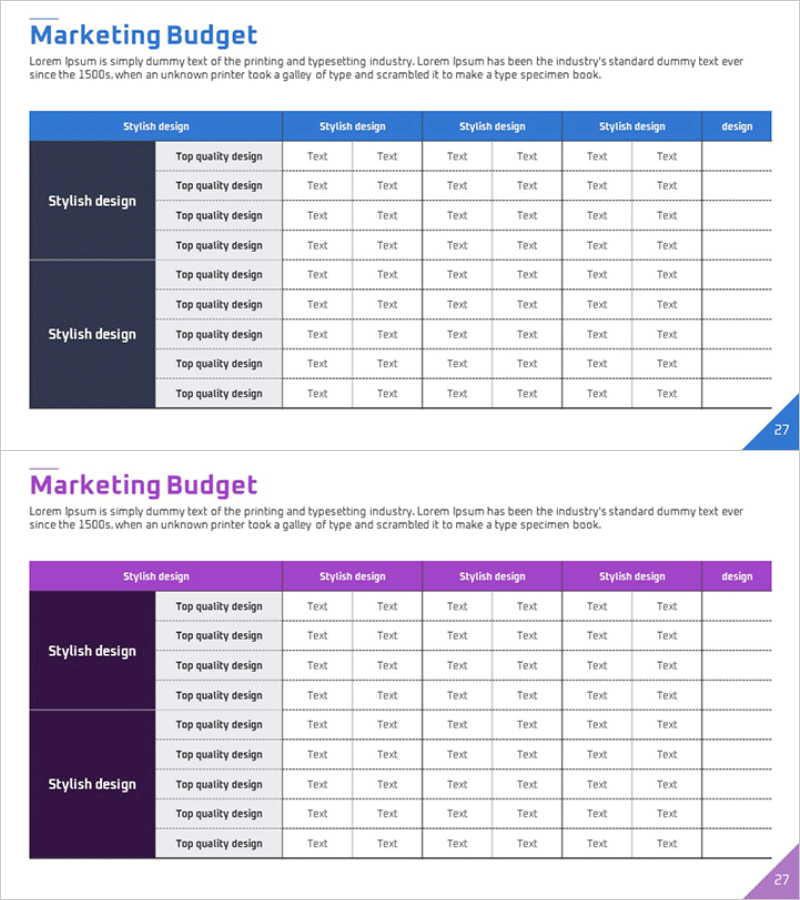
A financial analysis PowerPoint slide designed to present marketing budget allocation and performance metrics at a glance. Available in two color versions—blue and purple—each slide features a left-side description area paired with a multi-column table structure on the right. The table includes 8 rows of detailed line items with dedicated text fields for entering budget amounts, spending rates, ROI projections, and actual performance data. Formatted in 16:9 widescreen with 2 slides total, this template is ready to use in marketing plans, financial reports, investor presentations, and quarterly budget reviews.
Usage Points
-
Main Usage
This slide is designed to quantitatively present marketing department budget status, return on investment, and cost-to-performance ratios. The row-based layout allows multiple budget categories to be listed and compared across columns, making data analysis straightforward and visually organized.
-
How to Use
Enter department name and budget category in the left 'Stylish design' area, then populate the right table cells with budget amounts, actual spending, projected ROI, and actual results. Choose between blue or purple versions to match your corporate brand colors and presentation theme.
-
Recommended For
Ideal for marketing plans, financial reports, quarterly and annual budget reviews, investor presentations, and executive briefings. Best suited for marketing managers, financial analysts, and executives who need to communicate budget status and performance metrics quickly and clearly.
-
Slide Structure
Each slide divides into a fixed left area (stylish design text section) and a right-side table. The table contains 5 columns (Stylish design header plus 4 text columns) and 8 rows (Top quality design entries), providing capacity for up to 32 data points across budget categories and metrics.
Related Products
-

Marketing Budget Analysis Table – Efficient Budget Allocation
#Financial Plans and Performance #Diagram #Projected Return on Investment (ROI)
-

Marketing Budget Table Chart – Efficient Financial Planning
#Financial Plans and Performance #Diagram #Projected Return on Investment (ROI)
-

Potential and Plans for Attracting Additional Investment - Projected ROI and Strategic Budget Analysis
#Financial Plans and Performance #Diagram #Projected Return on Investment (ROI)
-

Medical Business Expected Funding Requirements Table – Efficient Financial Planning
#Financial Plans and Performance #Diagram #Projected Return on Investment (ROI)
