Agricultural Equipment Investment Plan Pie Chart
RJ0600073_7
- Last Update 07/09/2025
- File Size 4MB
- # of Slides 2
- File Format PPTX
- Slide Ratio 16:9
- Color
Keywords
About the Product
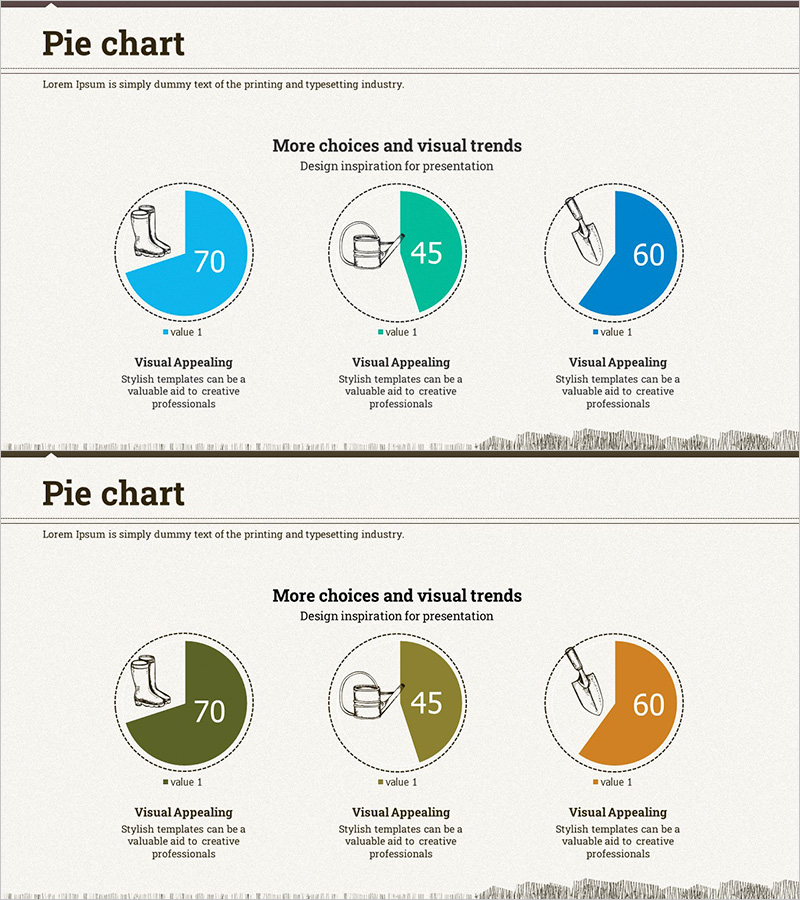
A 3-segment pie chart PowerPoint slide designed to visualize agricultural equipment investment plans with clear data representation. The circular charts are divided into three sections using blue, teal, and orange color schemes, enabling intuitive comparison of investment proportions. Each segment includes relevant icons and numerical data points to enhance information clarity. Optimized for 16:9 widescreen format with 2 slides ready for immediate use in business proposals, investment pitches, and market analysis presentations.
Usage Points
-
Main Usage
Visualizes capital allocation ratios in agricultural investment plans using pie charts to enhance stakeholder understanding. Enables side-by-side comparison of equipment-based, purpose-based, or region-based investment distribution, effectively demonstrating the rationality of fund allocation to investors and decision-makers.
-
How to Use
Apply this slide in the investment strategy section of business plans or during investor pitch presentations to explain current fund allocation. Customize by replacing numerical values with actual investment amounts and substituting icons to match specific agricultural equipment categories relevant to your proposal.
-
Recommended For
Ideal for agricultural enterprises, agritech startups, agricultural policy officials, investment managers, and agricultural consultants presenting investment plans. Particularly valuable for business proposals and investment pitches where equipment investment proportions require emphasis.
-
Slide Structure
2-slide set featuring 3 pie charts per slide. Each chart displays numerical data (70, 45, 60 values), color-coded segments in blue, teal, and orange, and agricultural-themed icons (machinery, tools) that symbolically represent investment categories.
Related Products
-

Pie Chart for Market Share Analysis – Data Visualization
#Market and Competitor Analysis #Graph #Market Status
-

Pie Chart for Workout Type Preferences – Market Status
#Market and Competitor Analysis #Diagram #Graph
-

Market Targets and Status Chart – Visually Appealing Insights
#Market and Competitor Analysis #Graph #Market Status
-

Pie Chart for Oriental Medicines Market Overview
#Market and Competitor Analysis #Graph #Market Status
