Blue Green Pie Chart – Simplifying Data Visualization
RJ0600027_7
- Last Update 06/27/2025
- File Size 0.2MB
- # of Slides 2
- File Format PPTX
- Slide Ratio 16:9
- Color
Keywords
About the Product
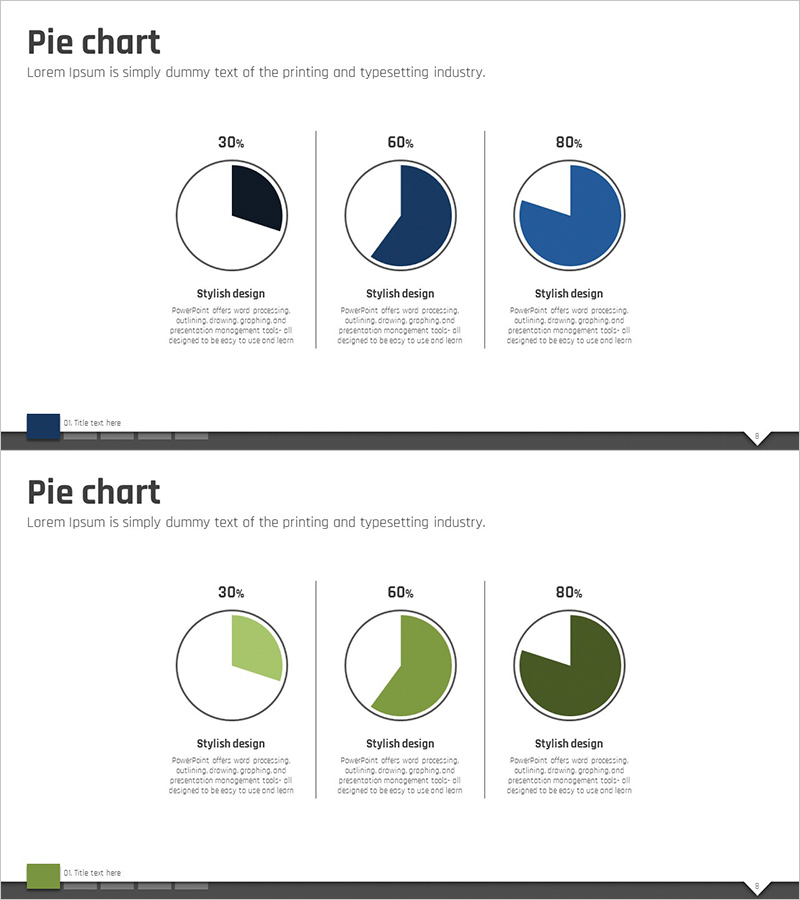
An intuitive pie chart PowerPoint slide template for visualizing data proportions across multiple scenarios. This 2-slide deck features blue and green dual-tone color schemes, displaying three ratio stages at 30%, 60%, and 80%. Each chart includes a descriptive text area below for adding context and insights. Available in 16:9 widescreen PPTX format, fully editable and ready to use. Perfect for presentations requiring market share analysis, budget allocation, customer segmentation, or composition breakdowns in business reports and strategic planning.
Usage Points
-
Main Usage
Clearly communicate proportional relationships such as market share, budget distribution, customer demographics, and sales breakdown. Visual pie chart representation enhances audience comprehension compared to raw numbers and effectively highlights key insights and strategic priorities.
-
How to Use
Replace the 'Stylish design' text area below each pie chart with your actual data descriptions and analytical findings. Adjust chart colors and percentages to match your dataset, and reorder slides according to your presentation flow. All elements are fully customizable within PowerPoint.
-
Recommended For
Finance reports, marketing analysis presentations, business plans, quarterly performance reviews, and customer segmentation studies. Ideal for finance professionals, marketing managers, executives, management consultants, and business analysts presenting composition data.
-
Slide Structure
2-slide layout with title section ('Pie chart') at top, three pie charts in the center (representing 30%, 60%, and 80% ratios), and descriptive text areas beneath each chart. Dual-tone blue and green color scheme provides visual distinction and professional appearance.
Related Products
-

Core Exercise Donut Chart – Visualizing Performance and Development
#Product/Service Introduction #Business Strategy #Graph
-

Speed Timer Diagram for Market Share Analysis
#Market and Competitor Analysis #Diagram #Graph
-

Gender Ratio Bar Graph – Market and Competitor Analysis
#Market and Competitor Analysis #Graph #Competitor Analysis
-

AI Neon Rhombus Visual Template – KPI Metrics Visualization
#Product/Service Introduction #Graph #Features
