Curved Theme Purple Pie Chart for Business Strategy and Vision Presentation
RJ0200068_5
- Last Update 04/18/2025
- File Size 1.3MB
- # of Slides 2
- File Format PPTX
- Slide Ratio 16:9
- Color
Keywords
- #Content-Based Slides
- #Design-Based Slides
- #Company Introduction
- #Business Vision and Strategy
- #Diagram
- #Graph
- #Shareholder Structure
- #Business Strategy
- #Cluster
- #Circles
- #Closed Cluster Diagram
- #Pie Chart
- #16:9
- #pie chart PowerPoint
- #circular graph presentation slide
- #ratio visualization template
- #business strategy chart
- #data visualization slide download
About the Product
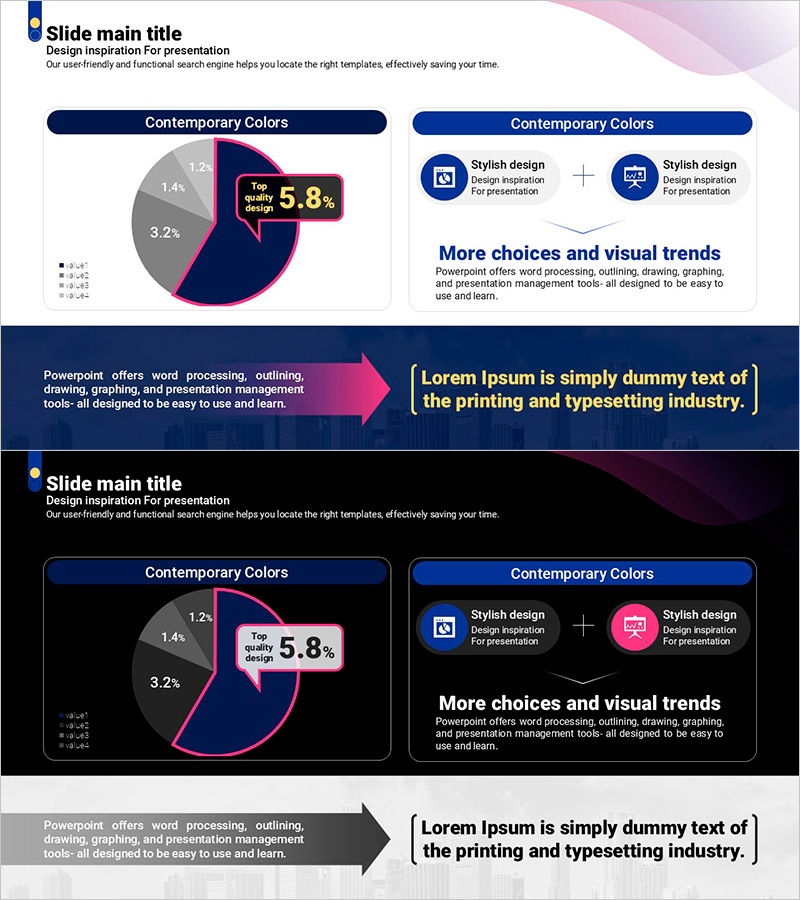
A professional pie chart PowerPoint slide designed to present business strategy and vision effectively. The 4-segment circular graph combines purple and gray tones with a curved arrow and highlight box to emphasize key metrics (5.8%). This 2-slide set is optimized for 16:9 widescreen format and enables flexible data ratio visualization. Perfect for executive presentations, business plan pitches, performance analysis reports, and stakeholder communications. All elements are fully editable for customization to your brand guidelines.
Usage Points
-
Main Usage
Visualize key metrics and proportions using pie chart design for executive reporting, strategic planning, and stakeholder presentations. The purple curved accent effectively highlights critical data points and draws audience attention to the most important segments.
-
How to Use
Two slides feature pie charts with editable segments. Replace default percentages and labels with your actual data. The curved arrow and highlight box can be repositioned to emphasize different segments. Colors and fonts are fully customizable to match your corporate branding and presentation theme.
-
Recommended For
Executives, business analysts, marketing managers, financial professionals, and consultants presenting quarterly results, market share, budget allocation, customer demographics, and performance metrics. Ideal for reports, proposals, business plans, and investor pitch decks.
-
Slide Structure
Slide 1: 4-segment pie chart (purple, gray, black, pink) + curved arrow + highlight box with 5.8% metric / Slide 2: Identical pie chart structure + descriptive text area. Each segment is independently editable with customizable legend and numerical labels.
Related Products
-

Advantages of SUV – Business and Strategic Benefits
#Product/Service Introduction #Business Vision and Strategy #Diagram
-

Objectives and Strategy Diagram for Business Strategy
#Business Vision and Strategy #Diagram #Business Strategy
-

Automotive Technology Business Direction Diagram – Visualizing Business Strategy
#Business Vision and Strategy #Diagram #Business Strategy
-

Introducing the Mobile App Service Program
#Product/Service Introduction #Business Vision and Strategy #Diagram
