Blue Yellow Pie Chart – Market and Competitor Analysis
RJ0600026_6
- Last Update 06/27/2025
- File Size 0.3MB
- # of Slides 2
- File Format PPTX
- Slide Ratio 16:9
- Color
Keywords
- #Content-Based Slides
- #Design-Based Slides
- #Market and Competitor Analysis
- #Graph
- #Competitor Analysis
- #Market Analysis
- #Circles
- #Pie Chart
- #16:9
- #pie chart PowerPoint slide
- #pie graph template
- #market analysis chart
- #competitor analysis PowerPoint
- #ratio data visualization
- #4-segment pie chart download
About the Product
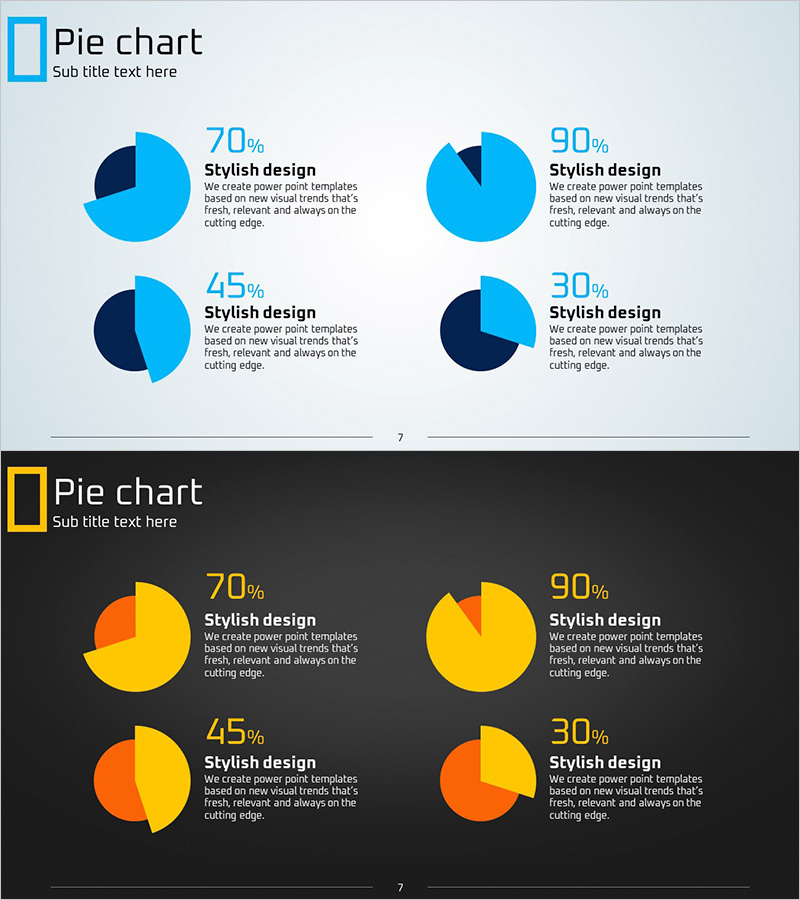
A professional pie chart PowerPoint slide template designed for market analysis and competitive comparison presentations. Features two distinct design variations: a light gray background version with blue and navy tones, and a dark gray background version with yellow and orange accents. Each layout displays four pie charts with clearly segmented sections for ratio data visualization. Ample text space beside each chart allows detailed descriptions of market share, customer segments, revenue distribution, or competitor positioning. Instantly applicable for business strategy presentations, quarterly reports, and data-driven decision-making materials.
Usage Points
-
Main Usage
Visualize four key metrics—market share, customer composition, revenue breakdown, or competitive positioning—using pie charts that enable instant audience comprehension. Each segment is distinctly colored and labeled, making data comparison intuitive and professional.
-
How to Use
Replace the sample percentages and labels with your actual data. Select the light background version for daytime presentations or bright meeting rooms, and the dark version for evening sessions or projector-based environments. All colors, fonts, and text positions are fully editable to match your brand guidelines.
-
Recommended For
Marketing managers, business strategists, financial analysts, management consultants, and data professionals preparing market reports, quarterly business reviews, investor presentations, or strategic planning documents. Ideal when ratio comparison and data-driven insights are critical to decision-making.
-
Slide Structure
2-slide template. Slide 1: light gray background with blue/navy pie charts and text areas. Slide 2: dark gray background with yellow/orange pie charts and text areas. 16:9 widescreen format optimized for modern presentation environments. Each slide contains 4 pie charts with accompanying description zones.
Related Products
-

Pie & Bar Analysis Graphs – Optimized for Market and Competitor Analysis
#Market and Competitor Analysis #Graph #Competitor Analysis
-

In-Depth Analysis Graph Chart – Optimized for Market and Competitor Analysis
#Market and Competitor Analysis #Graph #Other
-

Comparative Analysis Graph – Optimal Tool for Market and Competitor Analysis
#Market and Competitor Analysis #Graph #Competitor Analysis
-

Competitor Market Share Analysis Pie Chart
#Market and Competitor Analysis #Graph #Competitor Analysis
