Eco-friendly Donut Chart Analysis – Market Status Delivery
RJ0600026_32
- Last Update 06/27/2025
- File Size 0.4MB
- # of Slides 2
- File Format PPTX
- Slide Ratio 16:9
- Color
Keywords
About the Product
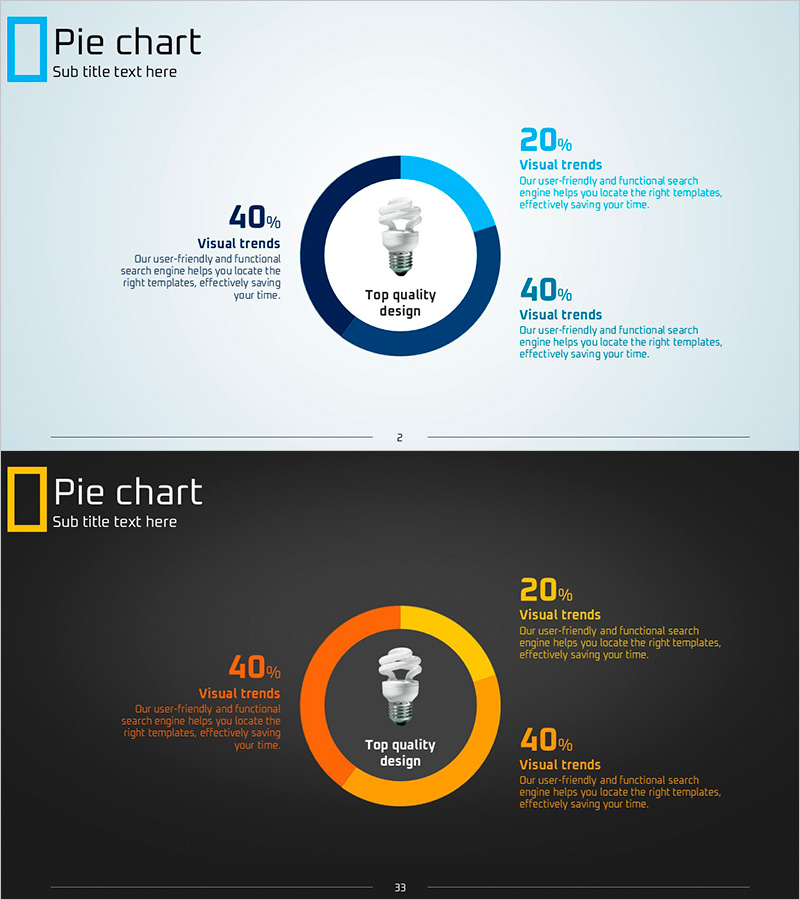
A donut chart PowerPoint slide designed to visualize market share and proportional data with clarity and impact. The slide features a three-segment donut chart with a central emphasis area for key messaging or imagery, surrounded by descriptive text labels on the right. The color scheme combines light blue background with navy, light blue, and white segments, creating a professional and data-focused presentation. Optimized for 16:9 widescreen format across 2 slides, this template enables effective communication of market positioning, competitive analysis, and composition ratios in business presentations and reports.
Usage Points
-
Main Usage
Effectively communicates proportional data such as market share, composition ratios, and segment distribution. The central focal area draws attention to key messaging while surrounding segments present detailed data, making complex information accessible to audiences.
-
How to Use
Ideal for business plans, marketing proposals, quarterly performance reports, and market analysis sections. Customize segment values, labels, and central imagery to match your specific data. Suitable for competitive analysis, customer demographics, revenue breakdown, and market positioning discussions.
-
Recommended For
Marketing professionals, sales teams, executives, investors, and analysts presenting market data. Recommended for investor pitch decks, quarterly business reviews, market research presentations, customer proposals, and strategic planning sessions.
-
Slide Structure
2-slide set. Slide 1: Light blue background with 3-segment donut chart (navy, light blue, white), central circular emphasis area, and right-aligned descriptive text for three data points. Slide 2: Alternative color variant with dark background and yellow-orange accent segments for visual variety.
Related Products
-

Distribution of Regulatory Components – Visualizing Market Conditions
#Market and Competitor Analysis #Graph #Market Status
-

Pie Chart for Decimal Ratio Analysis – Market Share Status
#Market and Competitor Analysis #Graph #Market Status
-

Donut Chart Focused on Key Category Analysis – Market Status and Share
#Market and Competitor Analysis #Graph #Market Status
-

Donut Chart for Components and Market Share Visualization – Market Analysis
#Market and Competitor Analysis #Graph #Market Status
