Horizontal Bar Graph Analysis by Gender – Market Insights
RJ0600026_29
- Last Update 06/27/2025
- File Size 0.3MB
- # of Slides 2
- File Format PPTX
- Slide Ratio 16:9
- Color
Keywords
About the Product
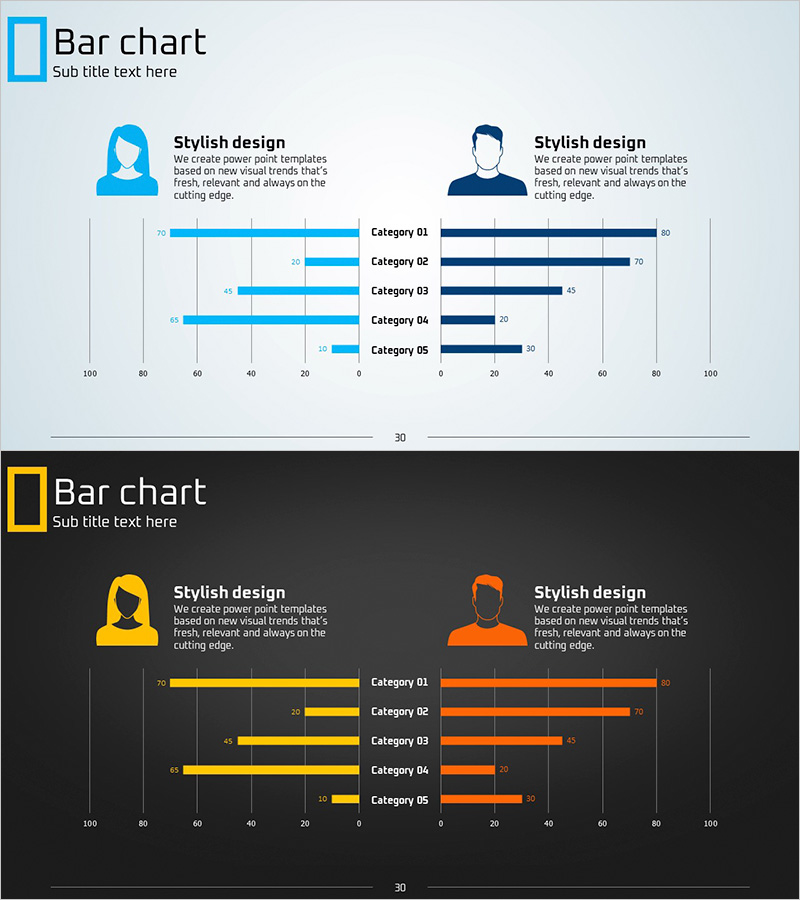
A horizontal bar chart PowerPoint slide for comparing gender-based market data with intuitive visual clarity. Featuring a light gray background with contrasting blue and navy bar series across 5 categories, each bar displays numeric labels for precise data reading. The 2-slide set presents female analysis on the left and male analysis on the right, with avatar icons and descriptive text in each section, ready for immediate use in market insights and customer segmentation presentations. Delivered in 16:9 widescreen PPTX format compatible with all presentation environments.
Usage Points
-
Main Usage
Compares gender, age group, and customer segment data using horizontal bar visualization. Ideal for market research findings, customer segmentation analysis, sales performance comparison, and survey results where category-by-category numeric comparison is essential.
-
How to Use
Input female data in the left section and male data in the right section, then adjust bar lengths and numeric labels accordingly. Avatar icons and descriptive text can be customized as needed, while maintaining the blue and navy color palette ensures a cohesive presentation appearance.
-
Recommended For
Marketing teams presenting customer analysis, sales teams reporting market segmentation, executive-level performance reviews, market research institutions visualizing data, and HR teams analyzing workforce composition. Particularly optimized for comparing dichotomous data such as gender, job level, and age groups.
-
Slide Structure
2-slide layout: Title area at top (Bar chart heading + subtitle), left section with female avatar + 5 horizontal bars (Category 01–05, values 10–80), right section with male avatar + 5 horizontal bars (same categories, values 20–100). Numeric labels displayed to the right of each bar, slide number at bottom.
Related Products
-

Male and Female Comparison Analysis Horizontal Bar Graph – Results and Insights
#Market and Competitor Analysis #Graph #Customer Analysis
-

Market and Competitor Analysis Horizontal Bar Graph – Visual Insights into Data
#Market and Competitor Analysis #Graph #Customer Analysis
-

Competitor Comparison Paired Bar Graph – A Powerful Tool for Market Analysis
#Market and Competitor Analysis #Graph #Customer Analysis
-

Two-way Chart of Male and Female Surveys – Gender Comparison Visualization
#Market and Competitor Analysis #Graph #Customer Analysis
