Horizontal Bar Graph Segmentation Blue Yellow – Market Share Analysis
RJ0600026_21
- Last Update 06/27/2025
- File Size 12.1MB
- # of Slides 2
- File Format PPTX
- Slide Ratio 16:9
- Color
Keywords
- #Content-Based Slides
- #Design-Based Slides
- #Market and Competitor Analysis
- #Graph
- #Market Share
- #Market Analysis
- #Horizontal Bar
- #Segmented Horizontal Bar
- #16:9
- #horizontal bar chart PowerPoint
- #segmented graph slide
- #market share analysis template
- #multi-series bar chart
- #comparative data visualization
- #how to create stacked bar chart in PowerPoint
About the Product
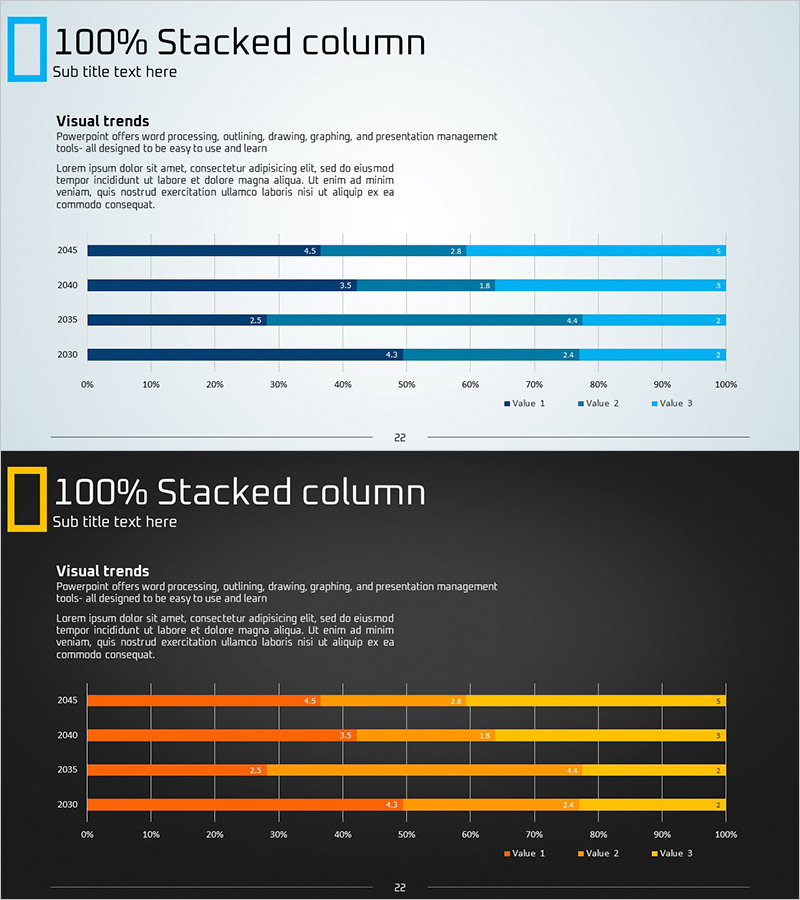
A horizontal bar chart PowerPoint slide designed to compare and analyze multi-series data such as market share, sales distribution, and customer segments. Four data series are distinguished by color—dark blue, medium blue, light blue, and yellow—creating a clear visual hierarchy for segmented numerical data. The 0–100% scale enables intuitive representation of proportional information, while the year-over-year structure (2030–2045) allows simultaneous display of time-series trends and category comparisons. This presentation template is ready for immediate use in reports, business proposals, and strategic presentations.
Usage Points
-
Main Usage
Optimized for comparing multiple categories of proportional data and displaying time-series changes simultaneously. Effectively visualizes segmented numerical information such as market share percentages, revenue composition, customer demographic distribution, and departmental budget allocation.
-
How to Use
Input data for each year row and the bar lengths adjust automatically. Modify legend colors to match your brand identity, and edit year labels or category names to adapt the slide for various analytical presentations and reports.
-
Recommended For
Marketing managers, sales analysts, business executives, consulting firms, financial analysts, and strategic planners who need to present market analysis, competitive comparisons, and performance reviews in professional settings.
-
Slide Structure
Two-slide set. First slide features a light gray background with one 4-series horizontal bar chart; second slide displays the same chart structure on a dark background. Both slides include title, subtitle, and data labels with a 0–100% horizontal axis and year-labeled categories clearly marked.
Related Products
-

Soccer Match Analysis Chart – Performance Analysis and Future Forecast
#Business Vision and Strategy #Market and Competitor Analysis #Graph
-

Male and Female Real Estate Holding Status Graph – Market Share at a Glance
#Market and Competitor Analysis #Graph #Market Share
-

Financial Plans and Performance Presentation Template – Professional and Reliable Design
#Market and Competitor Analysis #Financial Plans and Performance #Graph
-

Subdivided Graph for Analysis Results – Market Analysis and Customer Feedback
#Market and Competitor Analysis #Customer Success Stories #Graph
