Male and Female Real Estate Holding Status Graph – Market Share at a Glance
RJ0900012_27
- Last Update 08/19/2025
- File Size 0.1MB
- # of Slides 2
- File Format PPTX
- Slide Ratio 16:9
- Color
Keywords
- #Content-Based Slides
- #Design-Based Slides
- #Market and Competitor Analysis
- #Graph
- #Market Share
- #Market Analysis
- #Horizontal Bar
- #Circles
- #Segmented Horizontal Bar
- #Pie Chart
- #16:9
- #pie chart PowerPoint slide
- #2-segment circular graph presentation
- #real estate market share chart
- #ratio analysis template
- #data visualization slide download
About the Product
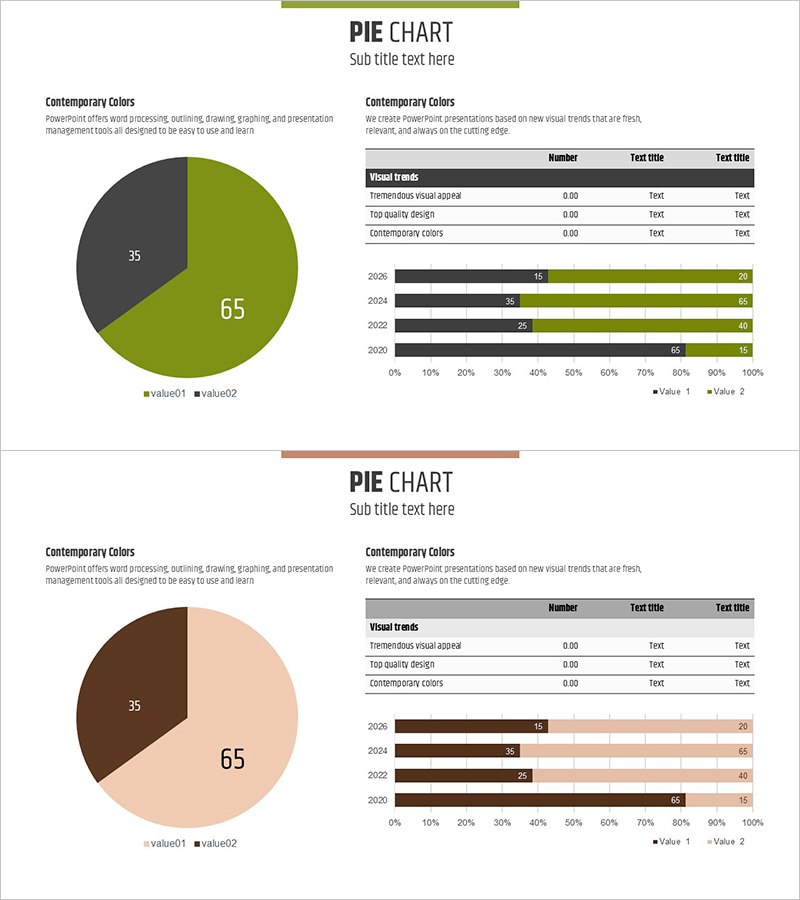
A PowerPoint slide that visualizes real estate market share and gender-based holding status using a 2-segment pie chart. The design employs contrasting lime green and charcoal tones to clarify data comparison, with a horizontal bar graph and data table positioned on the right to enhance quantitative information delivery. The 2-slide set offers multiple color combinations (green-charcoal and brown-beige) for flexible presentation context selection. Immediately applicable for market analysis and customer segmentation materials in real estate, finance, and marketing sectors.
Usage Points
-
Main Usage
Expresses real estate market data, customer segmentation, and gender-region ratio analysis through a combination of pie and bar charts for intuitive understanding. Delivers both quantitative figures and visual proportions simultaneously for decision-making materials.
-
How to Use
Slide 1 uses lime green-charcoal tones; Slide 2 uses brown-beige tones—select based on presentation theme. Replace pie chart values (35/65) and bar graph year-over-year data (2020–2026) with actual statistics for immediate deployment.
-
Recommended For
Ideal for real estate agencies, financial institutions, and marketing teams presenting market analysis. Effective for investor presentations, quarterly performance reports, and customer targeting strategy sessions to enhance data credibility.
-
Slide Structure
Each slide contains a 2-segment pie chart (2 nodes, 35/65 ratio), horizontal bar graph on the right (4 years, 2-series data), and data table below (3 rows × 3 columns). Includes title and subtitle areas across 2 slides total.
Related Products
-

Focus Chart of Subject Proportions – Visualizing Market Share
#Market and Competitor Analysis #Graph #Market Share
-

Creative Line PPT Pie Chart Analysis – Visualizing Market Share
#Market and Competitor Analysis #Graph #Market Share
-

Target Market Share Analysis – Visualizing Market Analysis with Pie Chart
#Market and Competitor Analysis #Graph #Other
-

Share Analysis of Two Topics with Pie Chart
#Market and Competitor Analysis #Diagram #Graph
