India Travel-related Marketing Strategy – Performance-focused Cluster Diagram
RJ0600023_12
- Last Update 06/26/2025
- File Size 0.8MB
- # of Slides 2
- File Format PPTX
- Slide Ratio 16:9
- Color
Keywords
About the Product
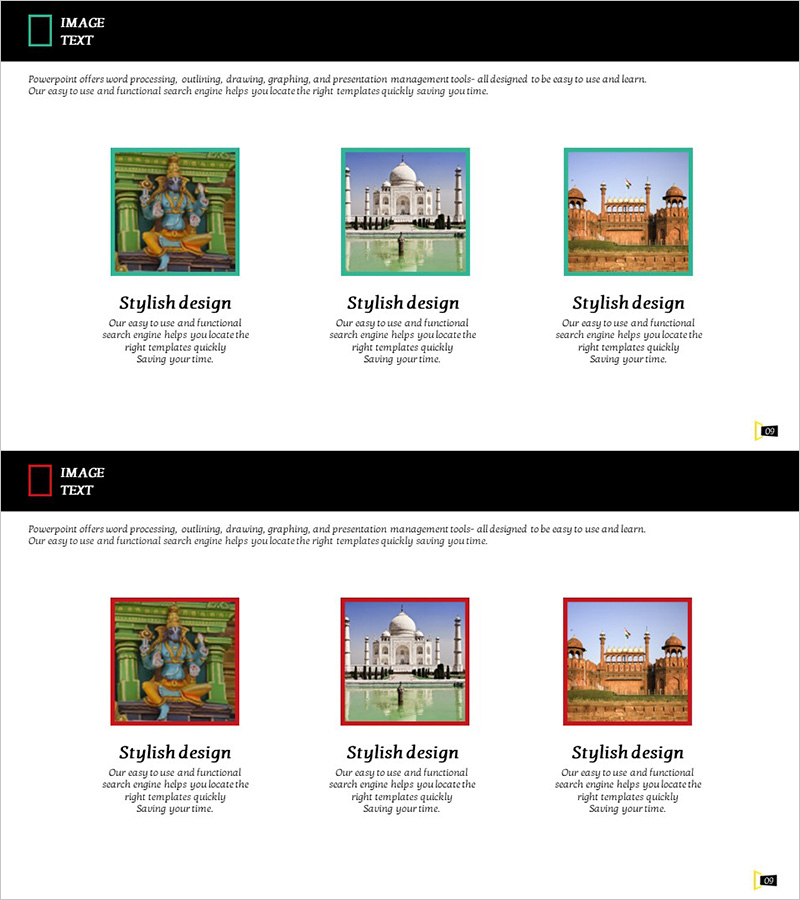
A closed cluster diagram PowerPoint slide optimized for India travel marketing strategy presentations. The design features a central core concept connected to three surrounding elements, effectively visualizing performance-driven strategic relationships. Turquoise borders and warm-toned imagery convey trust and credibility in the travel and tourism industry. With 2 slides included, this template is ready for immediate use in various marketing scenarios and can be adapted to other industries and strategies through simple text editing.
Usage Points
-
Main Usage
Clearly express the relationship between core marketing concepts and detailed execution elements. Place key performance indicators (KPIs) or strategic objectives in the central node, and position execution strategies, channels, and resources in the three surrounding nodes to communicate an integrated strategic framework.
-
How to Use
Use during the strategy framework explanation phase at the beginning of presentations or in marketing department meetings and executive briefings to emphasize strategic interconnections. Customize each node's text to transform the diagram into product introductions, organizational structures, or project relationship maps.
-
Recommended For
Recommended for marketing professionals, strategic planning teams, travel and tourism industry specialists, and executives presenting strategic relationships. Particularly suitable for B2B presentations and consulting proposals where emphasizing mutual influence between central concepts and surrounding elements is critical.
-
Slide Structure
2-slide layout. The first slide features a closed cluster with turquoise borders (1 central node + 3 surrounding connected nodes), while the second slide presents the same structure with red borders. Each node is designed as an editable text input area, optimized for 16:9 widescreen format.
Related Products
-

Customer Behavior Analysis by Country – Strategic Business Proposal
#Business Strategy #Market and Competitor Analysis #Diagram
-

Introduction to Nature Theme Achievements – Vision and Success
#Business Vision and Strategy #Business Strategy #Diagram
-

Medal Text Box – Highlighting Achievements in Presentations
#Company Introduction #Business Strategy #Diagram
-

Data Trend Analysis with Line Chart – Professional Insight and Visual Inspiration
#Business Strategy #Marketing Plan and Strategy #Diagram
