Eco-friendly Donut Chart Blue Green – Visualizing Market Share
RJ0600022_5
- Last Update 06/26/2025
- File Size 2.6MB
- # of Slides 2
- File Format PPTX
- Slide Ratio 16:9
- Color
Keywords
- #Content-Based Slides
- #Design-Based Slides
- #Product/Service Introduction
- #Market and Competitor Analysis
- #Graph
- #Development Status
- #Market Share
- #Circles
- #Doughnut Chart
- #16:9
- #donut chart PowerPoint
- #pie chart slide template
- #ratio visualization
- #market share chart
- #how to create donut chart in PowerPoint
- #PowerPoint graph slide design
About the Product
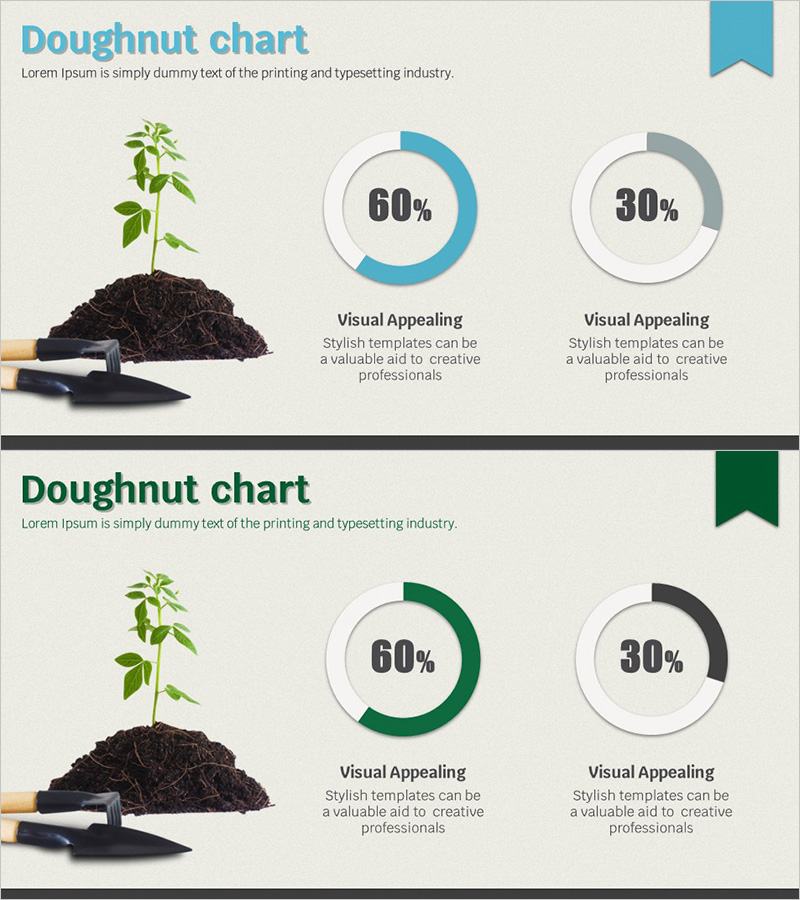
A donut chart PowerPoint slide set designed to visualize the ratio of two items such as market share, product composition, or budget allocation. Featuring blue and green color schemes across 2 slides, this template is ideal for eco-friendly themed presentations. The center circular area allows for numeric input, enabling flexible data representation. Optimized for 16:9 widescreen format, this PPT graph template is ready to use in product introductions, business analysis, marketing reports, and sustainability-focused presentations.
Usage Points
-
Main Usage
Visualizes the proportional relationship between two data points using a donut chart format, making it ideal for presenting market share, product composition, budget allocation, and customer satisfaction metrics. The center circular area can highlight key figures or messages for emphasis.
-
How to Use
Use in product introduction slides to show competitive market positioning, in business reports to display revenue composition, or in marketing plans to illustrate target customer analysis. Suitable for investment pitch decks presenting portfolio composition ratios and sustainability-focused presentations.
-
Recommended For
Product marketing managers, business analysts, financial reporting professionals, consultants, educators, and presenters who need to communicate ratio-based data clearly. The eco-friendly color theme makes it particularly suitable for sustainability and environmental initiative presentations.
-
Slide Structure
Two-slide set, each featuring two donut charts (60% blue with 30% gray / 60% green with 30% gray). Layout includes a plant illustration on the left and charts with descriptive text areas on the right, optimized for 16:9 widescreen format.
Related Products
-

Website Technology Development Status Graph – Market Share and Trends
#Product/Service Introduction #Market and Competitor Analysis #Graph
-

Graph of Analysis of Transportation Development Status
#Product/Service Introduction #Market and Competitor Analysis #Graph
-

Financial Business Analysis Pie Chart – Market Share Insights
#Product/Service Introduction #Market and Competitor Analysis #Graph
-

Analysis of Transportation Usage Status – Pie Chart
#Product/Service Introduction #Market and Competitor Analysis #Graph
