Triangle Vertical Graph Slide – Visualizing Ratio Comparison
RJ0600021_11
- Last Update 06/26/2025
- File Size 0.1MB
- # of Slides 2
- File Format PPTX
- Slide Ratio 16:9
- Color
Keywords
About the Product
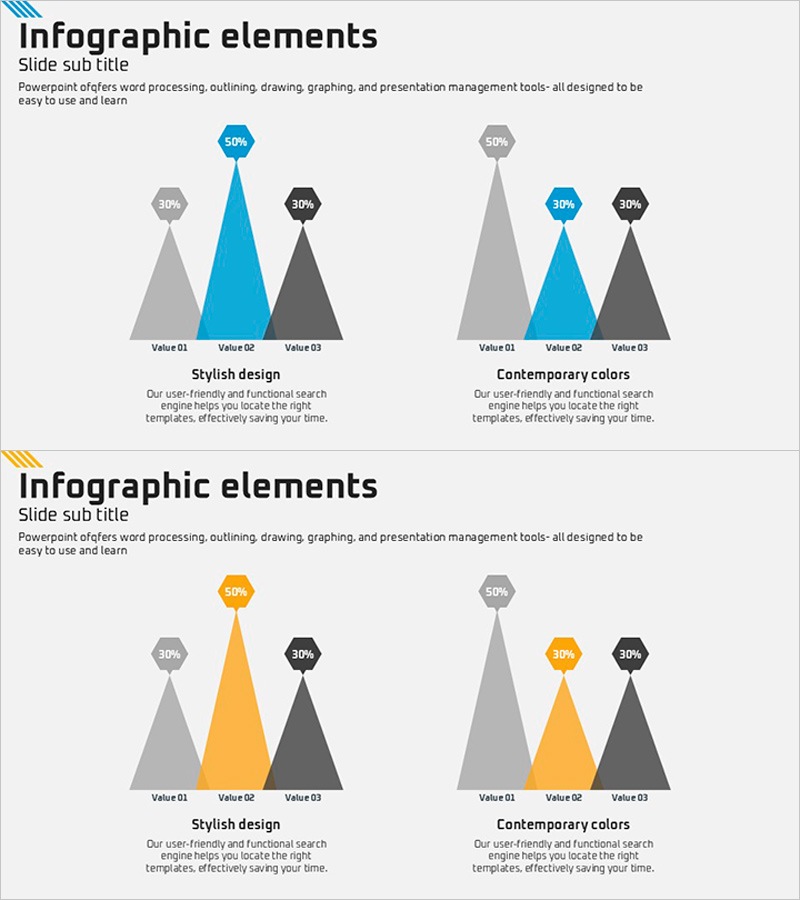
A PowerPoint slide that visualizes the numerical ratio of three items through triangle height, making data comparison intuitive and immediate. The design uses a blue-orange-gray color combination to distinguish data series, with percentage badges positioned above each triangle for precise value communication. Two color themes (blue and orange) are provided, allowing you to select the version that matches your presentation tone. Comprising 2 slides optimized for 16:9 widescreen format, this template is ready for immediate editing and use in reports and analyses.
Usage Points
-
Main Usage
Visualizes the relative proportion of three items for marketing analysis, market share, budget allocation, and performance comparison. Triangle height differences convey numerical magnitude intuitively, while percentage badges display exact data simultaneously.
-
How to Use
Use in the data section of business reports, marketing plans, and analysis documents. Replace the text labels (Value 01, 02, 03) and percentages with your actual data. Select either the blue or orange theme version that best matches your overall presentation design.
-
Recommended For
Financial analysts, marketing professionals, executives preparing reports, and consultants creating proposals benefit from this template when communicating ratio-based data. Ideal for any presentation scenario requiring emphasis on three-item composition ratios.
-
Slide Structure
2-slide layout: left side features blue theme (center triangle 50%, side triangles 30%), right side shows orange theme (identical structure). Each triangle topped with hexagonal percentage badge, bottom section includes Value 01-03 labels and descriptive text areas.
Related Products
-

Trends in Heavy Equipment Utilization – Market Analysis
#Business Introduction #Market and Competitor Analysis #Graph
-

Green Yellow Area Chart – A Fresh Approach to Data Visualization
#Graph
-

User Analysis Graph by Age Group – Advanced Data Insights
#Market and Competitor Analysis #Diagram #Graph
-

Comparison of Change Curves – Market and Competitor Analysis
#Market and Competitor Analysis #Graph #Market Status
