Natural Environment Main Target Audience Analysis Donut Chart
RJ0600020_8
- Last Update 06/26/2025
- File Size 0.7MB
- # of Slides 2
- File Format PPTX
- Slide Ratio 16:9
- Color
Keywords
About the Product
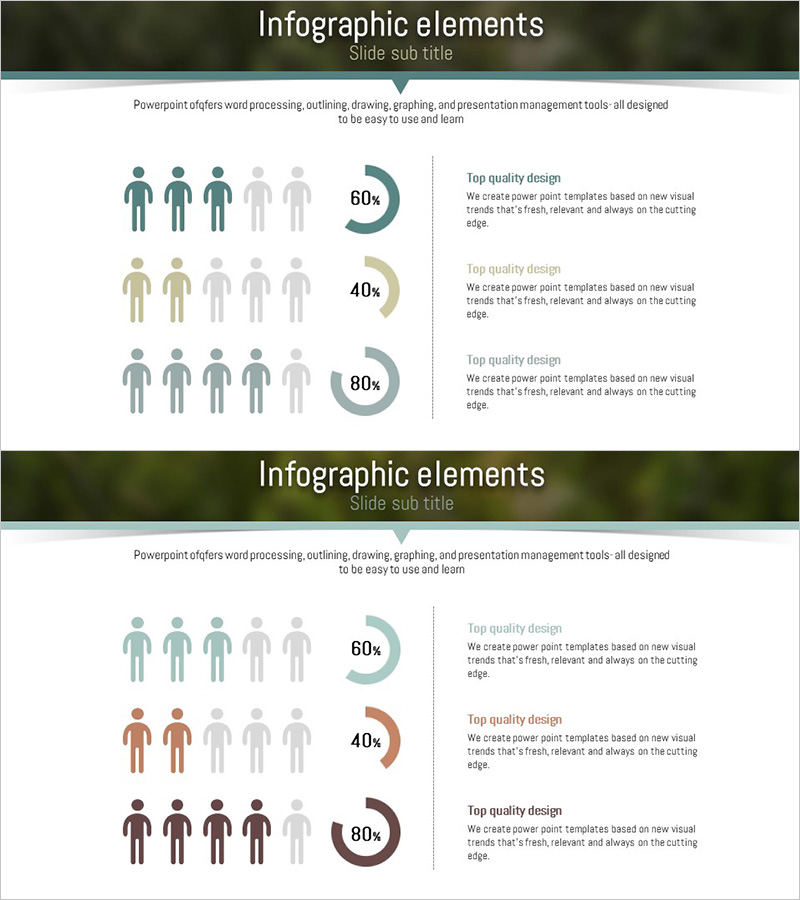
A PowerPoint slide featuring donut charts designed to visualize target audience segments for natural environment-related businesses. This presentation template displays three pie chart series with audience icons, enabling clear representation of customer distribution by demographic group. Optimized for 16:9 widescreen format with 2-slide composition, this slide deck is ready to use in market analysis and customer segmentation presentations. Customize the data directly in PowerPoint to match your business context. Ideal for business plans, market reports, proposals, and sustainability-focused pitch decks in the environmental and eco-friendly sectors.
Usage Points
-
Main Usage
Visualize customer segments and market composition for environmental, eco-friendly, and sustainability-focused businesses using donut chart graphics. The three-series pie chart format enables quick comparison of audience distribution percentages, supporting data-driven marketing strategy and customer targeting decisions.
-
How to Use
Insert this slide into business plans, marketing strategy presentations, and investor pitch decks during the market analysis section. Replace the sample percentages with your actual data, update audience labels, and add supporting text to align with your presentation narrative.
-
Recommended For
Marketing teams, business development professionals, and strategy planners in environmental consulting, eco-product companies, and sustainability-focused organizations. Also suitable for environmental policy reports, corporate sustainability presentations, and CSR communications.
-
Slide Structure
2-slide layout featuring three donut chart series per slide. Left side displays audience silhouette icons representing customer segments; right side shows percentage values and descriptive text areas. This arrangement allows simultaneous presentation of data visualization and interpretive commentary.
Related Products
-

Internet of Things User Analysis Status – Customer Insights and Data Visualization
#Product/Service Introduction #Market and Competitor Analysis #Graph
-

Customer Analysis Donut Chart - Visualizing Market Share
#Market and Competitor Analysis #Graph #Other
-

Customer Share Analysis Chart – Insights for Successful Business
#Market and Competitor Analysis #Graph #Other
-

Customer Analysis Infographic Chart – Visualizing Competitive Edge
#Market and Competitor Analysis #Graph #Other
