Donut Chart for Natural Environment Analysis – Visualizing Market Share
RJ0600020_3
- Last Update 06/26/2025
- File Size 12.5MB
- # of Slides 2
- File Format PPTX
- Slide Ratio 16:9
- Color
Keywords
About the Product
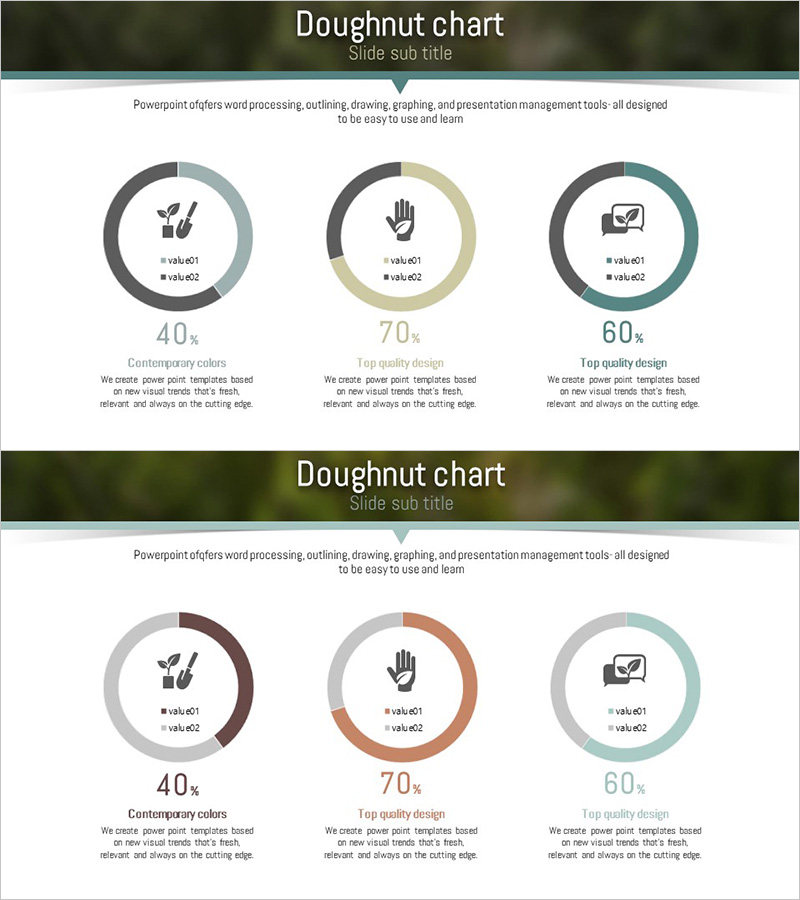
A PowerPoint slide featuring three concentric donut charts for visualizing market share and comparative data analysis. Each chart displays percentage values with corresponding icons and legend text, arranged in a balanced three-column layout. The design combines a dark olive background with gray, beige, and teal chart accents, creating a professional appearance suitable for product presentations, market analysis reports, and investor materials. The slide structure allows for easy data input and immediate use in business presentations.
Usage Points
-
Main Usage
Simultaneously visualize three key metrics such as market share, product comparison, or performance indicators using concentric donut charts. The unified layout ensures consistency while allowing each chart to represent independent datasets.
-
How to Use
Use in product introduction sections to display market share against competitors, or in investor presentations to report business performance across three dimensions. Edit the percentage values and legend text for each donut chart to input actual data and create presentation-ready slides.
-
Recommended For
Product marketing managers, business development teams, investor relations professionals, and executives preparing performance reports. Ideal for presentations requiring data-driven decision-making such as market analysis, competitive analysis, and performance reporting.
-
Slide Structure
The slide comprises a title area, descriptive text section, and three donut chart zones. Each chart uses a dual-ring structure to display two data values, with icons, percentages, and legend text clearly positioned to establish information hierarchy.
Related Products
-

Idea Development Status Graph – Clear Data Visualization with Doughnut Chart
#Product/Service Introduction #Market and Competitor Analysis #Graph
-

Financial Business Analysis Pie Chart – Market Share Insights
#Product/Service Introduction #Market and Competitor Analysis #Graph
-

Development Status Analysis Comparison Graph – Market Share & Growth
#Product/Service Introduction #Market and Competitor Analysis #Graph
-

Graph of Analysis of Transportation Development Status
#Product/Service Introduction #Market and Competitor Analysis #Graph
