Sports Analysis Bar Chart – Easy Performance Monitoring Option
RJ0600013_6
- Last Update 06/24/2025
- File Size 1.7MB
- # of Slides 2
- File Format PPTX
- Slide Ratio 16:9
- Color
Keywords
- #Content-Based Slides
- #Design-Based Slides
- #Business Strategy
- #Market and Competitor Analysis
- #Graph
- #Achievements
- #Market Status
- #Horizontal Bar
- #Horizontal Bar Chart
- #16:9
- #horizontal bar chart PowerPoint
- #bar graph slide template
- #sports performance analysis presentation
- #performance monitoring slides
- #data comparison diagram
About the Product
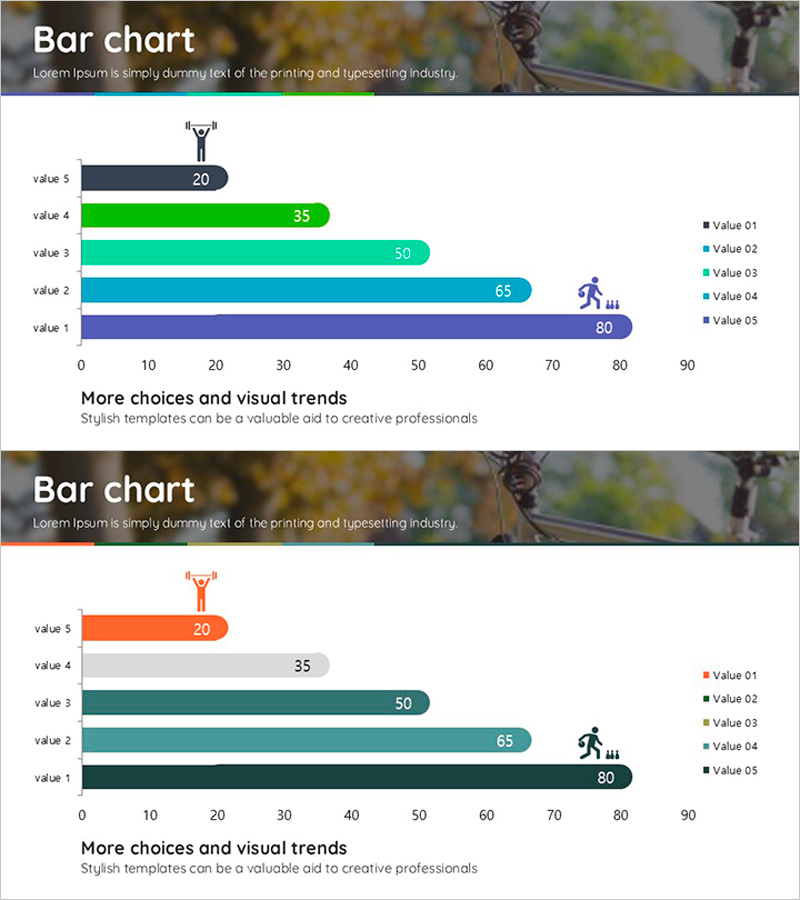
A horizontal bar chart PowerPoint slide designed to visualize sports team performance metrics across five categories. The slide features five distinct colors—navy blue, green, teal, orange, and gray—enabling clear numerical comparison of each item. Sports-related icons (weightlifting and mountain symbols) positioned on the right reinforce the sports analytics context. Available in 16:9 widescreen format with two fully editable slides, this template is ideal for performance monitoring presentations, team evaluations, competitive benchmarking, and sports analytics reports.
Usage Points
-
Main Usage
Visualize sports team performance metrics and competitive data through horizontal bar charts, enabling clear numerical comparison and performance trend analysis for stakeholder presentations.
-
How to Use
Each bar's length and color represent one of five data points, allowing instant visual comparison. The two-slide set provides a base design and a color variation option—select the version that best matches your presentation theme and edit the values directly in PowerPoint.
-
Recommended For
Sports team coaches and analysts, sports marketing professionals, athletic directors, sports management educators, performance evaluation report creators, and sports business consultants presenting team metrics and competitive analysis.
-
Slide Structure
Five horizontal bars arranged vertically, each labeled (value 1–5) with distinct colors: navy, green, teal, orange, and gray. Data values are displayed at the bar endpoints. Sports icons appear on the right side. Both slides maintain identical structure with alternative color schemes.
Related Products
-

Farm Bar Graph for Market Analysis – Formulating Effective Business Strategies
#Business Strategy #Market and Competitor Analysis #Graph
-

Children’s Activity Preferences Comparison – Market Status and Competitive Advantage
#Market and Competitor Analysis #Graph #Market Status
-

Donut Chart for Adventure Supplies – Business Strategy
#Business Strategy #Market and Competitor Analysis #Graph
-

Market Analysis Broken Line Graph – Visualizing Business Performance
#Business Strategy #Market and Competitor Analysis #Graph
