Windmill Arrow Infographic - Visually Appealing Slide
RJ0600019_34
- Last Update 06/26/2025
- File Size 0.4MB
- # of Slides 2
- File Format PPTX
- Slide Ratio 16:9
- Color
Keywords
About the Product
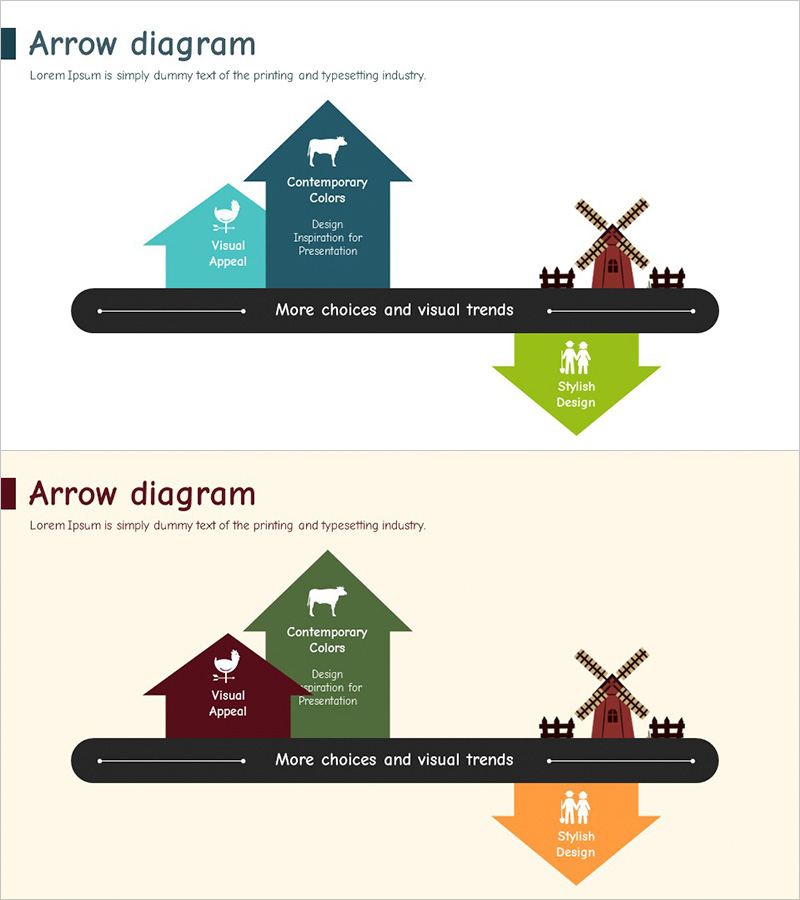
A PowerPoint slide featuring a windmill and arrow-based multi-stage process flow visualization. The design uses a blue, green, and turquoise color palette to establish clear visual hierarchy, connecting three key elements at the top (Visual Appeal, Contemporary Colors, Design Inspiration) through a central flow line with windmill and arrow icons, leading to a result element at the bottom (Stylish Design). The 2-slide set includes color variations (blue-green and wine-orange) for flexible presentation adaptation. Ideal for operational plans, business strategy presentations, and process explanations where sequential decision-making is essential.
Usage Points
-
Main Usage
Designed to visually represent multi-stage processes, operational workflows, and business strategy phases. The windmill icon and arrow connectors intuitively convey sequential progression, while text input areas allow you to clearly articulate decision-making rationale at each stage.
-
How to Use
Enter key implementation elements in the three top boxes, add process stages along the central flow line, and input final objectives in the bottom result area. Use the blue-green slide and wine-orange slide separately for visual variety across sections, or maintain consistent color throughout for unified presentation design.
-
Recommended For
Ideal for business strategy, operational planning, process improvement, and organizational change management presentations. Effective for executives, team leaders, and project managers explaining phased execution plans, or in consulting and training materials visualizing learning pathways.
-
Slide Structure
Two-slide set with each slide featuring three input boxes at the top (icon + text), a horizontal center flow line with windmill, arrow, and building icons, and one result box at the bottom (arrow shape). Color variations include blue-green-turquoise and wine-orange options, allowing selection based on presentation topic and brand colors.
Related Products
-

Infographic Template for Issue Resolution – Practical Guide
#Operational Plan #Technical Approach #Diagram
-

Construction Equipment Step Diagram – A Tool for Efficient Operations
#Business Vision and Strategy #Operational Plan #Text Box
-

Eco-friendly Solutions Arrow Diagram and Text Slide
#Product/Service Introduction #Operational Plan #Diagram
-

Pros and Cons Arrow Text Box – Data Visualization
#Product/Service Introduction #Operational Plan #Diagram
