Farm Aftercare and Maintenance Blue Green Template – Effective Market Analysis
RJ0600019_28
- Last Update 06/26/2025
- File Size 0.3MB
- # of Slides 2
- File Format PPTX
- Slide Ratio 16:9
- Color
Keywords
- #Content-Based Slides
- #Design-Based Slides
- #Market and Competitor Analysis
- #Diagram
- #Market Share
- #Competitive Advantage
- #Cluster
- #Chain Diagram
- #16:9
- #donut chart PowerPoint slide
- #pie chart template
- #6-segment data visualization
- #proportion chart PowerPoint
- #data infographic slide
- #market analysis presentation template
About the Product
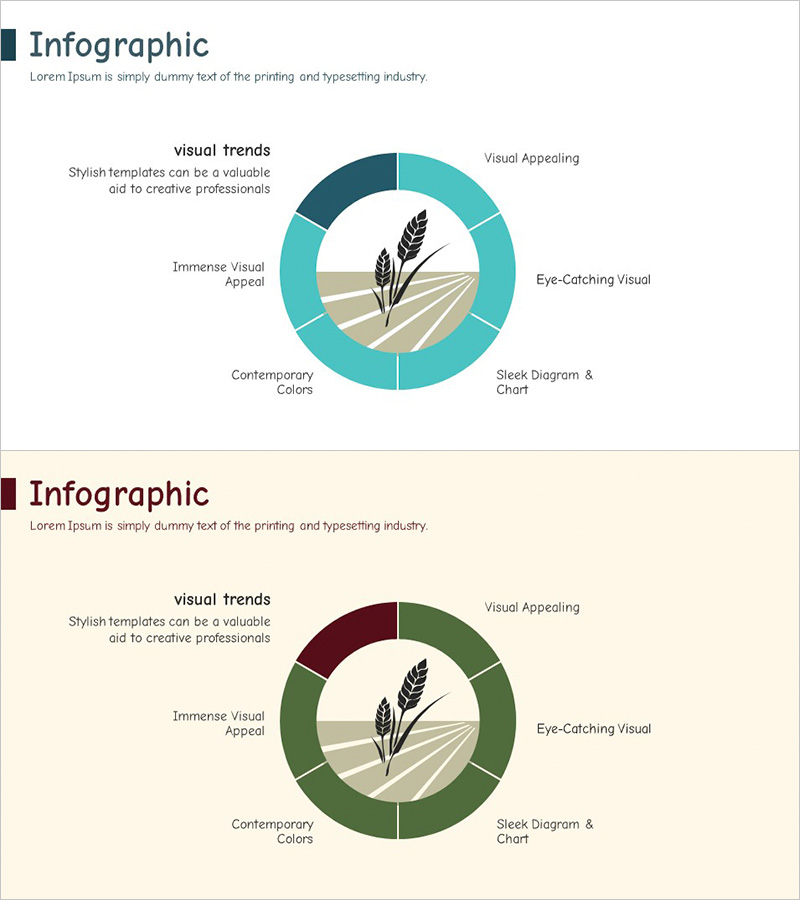
A donut chart PowerPoint slide with a central illustration showcasing six data segments in teal and dark tones. Each section includes label and description areas for easy customization. Perfect for market analysis, competitive positioning, and customer composition presentations. This 2-slide template offers color variations (teal and dark green) optimized for 16:9 widescreen format. Ideal for business reports, marketing decks, and strategic presentations requiring proportion-based data visualization.
Usage Points
-
Main Usage
Visualize data proportions and composition using a donut chart design. Effectively communicate market share, customer segment distribution, product category revenue breakdown, and competitive analysis through intuitive graphical representation.
-
How to Use
Edit section labels and numerical values to input your actual data. Replace the central illustration to match your presentation topic. Use the color variation slides to select your preferred background tone. Insert into business plans, marketing proposals, or quarterly reports in the market analysis section.
-
Recommended For
Marketing professionals, executives, business analysts, and consultants presenting data-driven insights. Particularly effective for market research findings, customer satisfaction surveys, product portfolio analysis, and competitive advantage presentations.
-
Slide Structure
Six-segment donut chart with farm and grain illustration centered. Label and description text areas positioned outside each segment. Two-slide set: teal background version and dark green background version for flexible color selection.
Related Products
-

Vegetable Competition Pie Chart – Market Share Analysis
#Market and Competitor Analysis #Graph #Market Share
-

Development Status Analysis Connection Diagram – Effective Information Delivery
#Product/Service Introduction #Market and Competitor Analysis #Diagram
-

Logistics Donut Chart – Performance and Market Shares
#Business Strategy #Market and Competitor Analysis #Diagram
-

Graph of Environmental Pollution – Market Share Analysis
#Market and Competitor Analysis #Graph #Market Share
