Farm Service Diagram – Operational Strategies and Technical Approaches
RJ0600019_24
- Last Update 06/26/2025
- File Size 0.3MB
- # of Slides 2
- File Format PPTX
- Slide Ratio 16:9
- Color
Keywords
- #Content-Based Slides
- #Design-Based Slides
- #Operational Plan
- #Technical Approach
- #Diagram
- #Production and Technology Development Strategy
- #Service Implementation Plan
- #Flow
- #Cluster
- #Multidirectional Flow
- #Chain Diagram
- #16:9
- #convergence diagram PowerPoint
- #process flow slide template
- #arrow structure diagram
- #integration diagram PPT
- #how to create process diagram in PowerPoint
About the Product
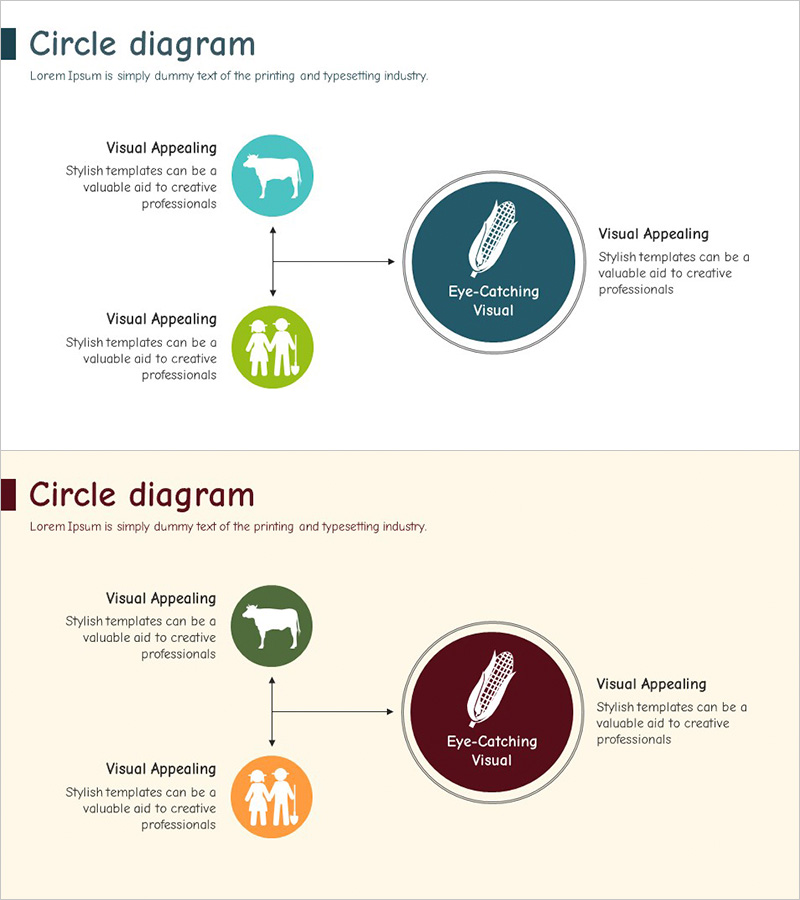
A 2-slide PowerPoint presentation featuring a convergence diagram that visualizes how multiple input elements flow into a central focal point. The left side contains two circular nodes with icons and text areas, connected by arrows to a larger central circle representing the core outcome. Two color variations are provided—one with a teal background and another with a beige background—allowing the same structure to be presented in different visual tones. The diagram effectively communicates process integration, strategic consolidation, and unified solutions. Ideal for business plans, operational strategy presentations, and service system explanations. Delivered in 16:9 widescreen PPTX format with fully editable elements.
Usage Points
-
Main Usage
Illustrates how multiple input elements (strategies, technologies, resources) converge into a single core result or outcome. Effectively communicates process integration, service systems, operational strategies, and unified solutions. The left-side nodes can be customized with different icons and text to adapt to various business contexts.
-
How to Use
Edit the two left-side circular nodes with your input elements (e.g., operational strategy, technical development) and the central large circle with your final outcome (e.g., service delivery). The arrows represent causality and integration, so adjust text and icons to match your presentation narrative. Both slides use identical structure with different background colors for visual variety.
-
Recommended For
Recommended for agricultural and livestock service companies presenting business plans, IT and consulting firms proposing integrated solutions, manufacturers explaining production processes, educational institutions introducing educational systems, and any professional needing to illustrate process convergence or strategic integration.
-
Slide Structure
Both slides feature identical layout: two circular nodes on the left (top and bottom) with icon and text areas, one large circular node in the center-right representing the core element, and two arrows connecting the left nodes to the central node. Slide 1 uses a teal background; Slide 2 uses a beige background, maintaining the same structure with different color schemes.
Related Products
-

Product Usage Process Diagram – Operations and Technical Aspect
#Operational Plan #Technical Approach #Diagram
-

Circle Puzzle Connected Diagram for Operational Planning – Efficient Service Execution
#Operational Plan #Technical Approach #Diagram
-

Analyzing Molecular Relationships through Diagrams – Cluster and Connection
#Operational Plan #Technical Approach #Diagram
-

Car Wide Template Puzzle Diagram - Operations and Technology
#Operational Plan #Technical Approach #Diagram
