Analyzing Molecular Relationships through Diagrams – Cluster and Connection
RB0800034_12
- Last Update 03/24/2025
- File Size 1.4MB
- # of Slides 2
- File Format PPTX
- Slide Ratio 4:3
- Color
Keywords
- #Content-Based Slides
- #Design-Based Slides
- #Operational Plan
- #Technical Approach
- #Diagram
- #Production and Technology Development Strategy
- #Service Implementation Plan
- #Cluster
- #Chain Diagram
- #4:3
- #hexagon diagram PowerPoint
- #cluster diagram slide template
- #node connection diagram
- #relationship diagram PPT
- #diagram slide design
About the Product
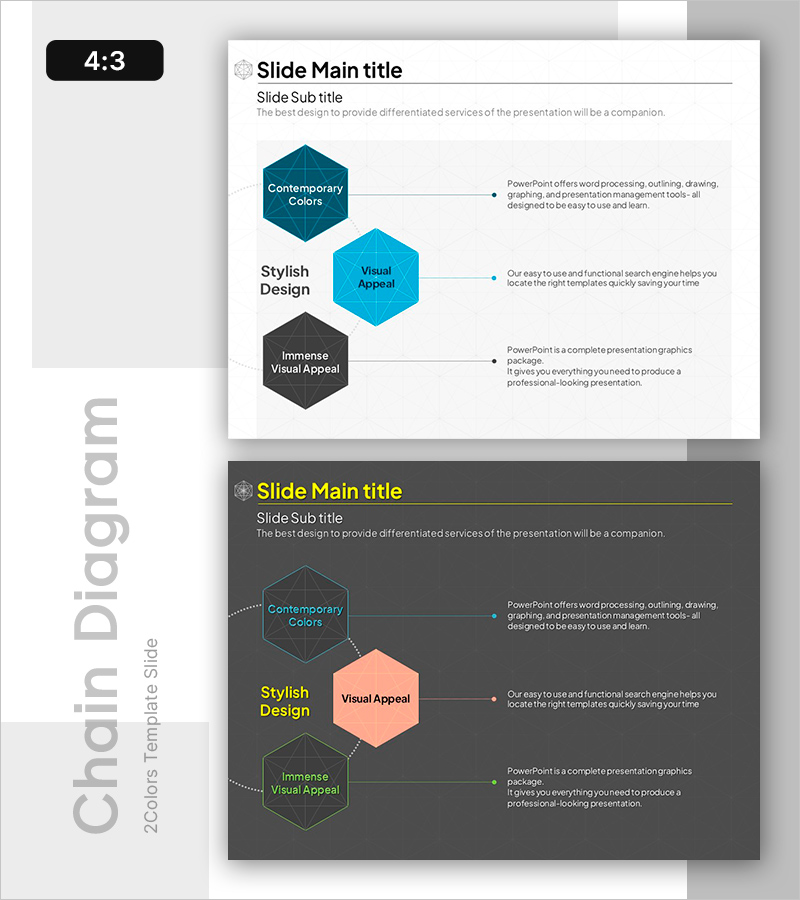
A PowerPoint cluster diagram slide featuring three hexagon nodes connected by arrows to visualize relationships and interactions. The nodes are color-coded in dark blue, light blue, and dark gray, each with text input areas and descriptive text on the right. Dotted connection lines represent relationships between nodes, making it ideal for illustrating interactions among technical components, operational processes, or analytical frameworks. This 4:3 ratio, 2-slide template is fully editable and ready for immediate use in presentations.
Usage Points
-
Main Usage
This diagram is optimized for visualizing interactions, relationships, and connection structures among three key elements. It effectively represents complex concepts such as technical architecture, operational processes, or analytical frameworks in a hierarchical manner, with dedicated text areas for detailed explanations of each node.
-
How to Use
Enter the main topic or component name in each hexagon node and add detailed descriptions in the text boxes on the right. Use different colors to distinguish categories, importance levels, or sequential stages. The dotted arrows indicate influence or dependency relationships between nodes. This layout works well for technical presentations, operational planning, and strategic framework slides.
-
Recommended For
Ideal for technical teams presenting system architecture, operations teams explaining process flows, strategy teams analyzing core elements, consultants presenting frameworks, and academics illustrating conceptual relationships. Particularly suited for fields requiring visualization of three-way interactions in technology, operations, and analysis.
-
Slide Structure
2-slide template with each slide containing three hexagon nodes (dark blue, light blue, dark gray) connected by dotted arrows. Each node has an internal text input area for titles, and the right side features descriptive text boxes for detailed explanations of each component.
Related Products
-

Farm Service Diagram – Operational Strategies and Technical Approaches
#Operational Plan #Technical Approach #Diagram
-

Car Wide Template Puzzle Diagram - Operations and Technology
#Operational Plan #Technical Approach #Diagram
-

Circle Puzzle Connected Diagram for Operational Planning – Efficient Service Execution
#Operational Plan #Technical Approach #Diagram
-

Product Usage Process Diagram – Operations and Technical Aspect
#Operational Plan #Technical Approach #Diagram
