Farm Target Analysis Marketing Donut Chart
RJ0600019_18
- Last Update 06/25/2025
- File Size 0.4MB
- # of Slides 2
- File Format PPTX
- Slide Ratio 16:9
- Color
Keywords
About the Product
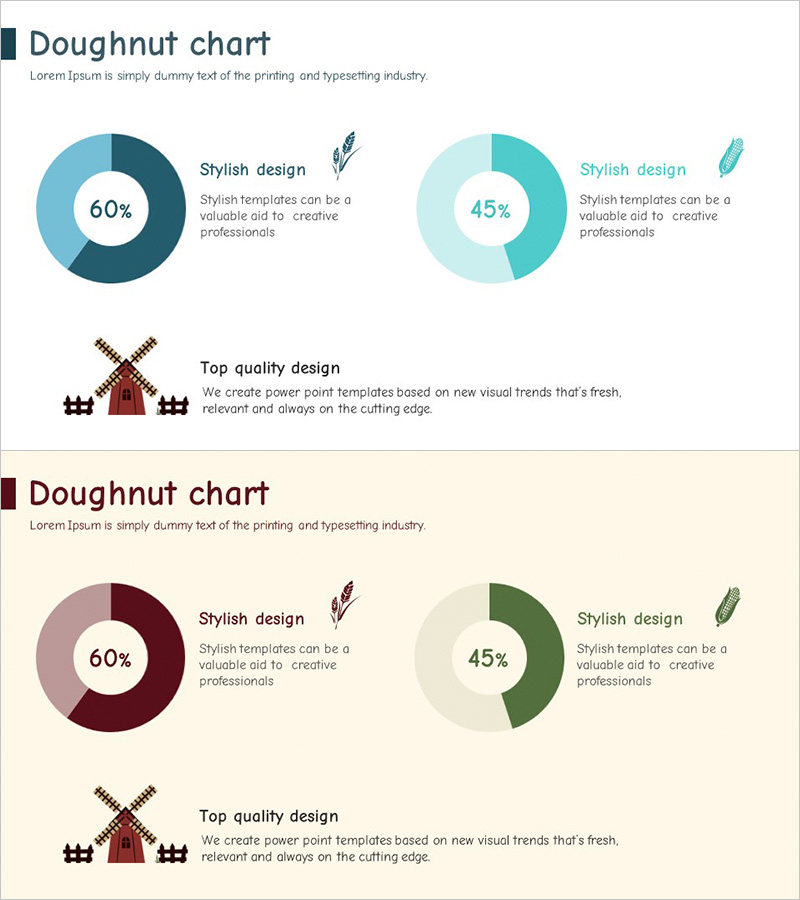
A professional donut chart PowerPoint slide designed for marketing analysis and market share visualization. Features two donut graphs in teal and dark blue tones, enabling simultaneous display of two data series with clear percentage values in the center. Text areas beside each chart provide space for labels, descriptions, and key metrics. Ideal for business presentations on target analysis, market positioning, and sales performance. Includes 2 slide layouts ready for immediate use.
Usage Points
-
Main Usage
Designed for marketing strategy presentations, market analysis reports, customer segmentation, and sales performance comparisons. The donut format allows viewers to quickly grasp proportional relationships between two datasets, with the center space highlighting key percentages or metrics.
-
How to Use
Input data values into each donut chart and proportions update automatically. Add item names, descriptions, and statistics in the adjacent text areas. Colors are fully editable to match corporate branding. Duplicate slides to present multiple data comparisons in a single presentation.
-
Recommended For
Marketing managers, sales directors, business analysts, market research professionals, and executive teams presenting customer demographics, market share distribution, sales channel breakdown, and product category revenue composition.
-
Slide Structure
2-slide set with dual donut charts per slide arranged horizontally. Each donut graph displays 2+ data series with percentage labels. Accompanying text blocks include 'Stylish design' headers and descriptive areas for data interpretation and supporting commentary.
Related Products
-

Bottled Beer Donut Chart – Market Share Visualization
#Market and Competitor Analysis #Marketing Plan and Strategy #Graph
-

Watercolor Customer Analysis Donut Chart – Visualizing Market Share
#Market and Competitor Analysis #Graph #Market Share
-

Analyzing Market Share with Donut Chart – Clean and Stylish Design
#Company Introduction #Market and Competitor Analysis #Graph
-

Red Sky Donut Chart – Market Share Analysis
#Company Introduction #Market and Competitor Analysis #Graph
