Farm Subdivision Vertical Bar Graph – Market Trend Analysis
RJ0600019_12
- Last Update 06/25/2025
- File Size 0.3MB
- # of Slides 2
- File Format PPTX
- Slide Ratio 16:9
- Color
Keywords
- #Content-Based Slides
- #Design-Based Slides
- #Market and Competitor Analysis
- #Graph
- #Market Status
- #Industry Trends
- #Column
- #Segmented Column
- #16:9
- #stacked column chart PowerPoint
- #multi-series bar graph template
- #market trend analysis slide
- #agricultural data visualization
- #4-series presentation slide
About the Product
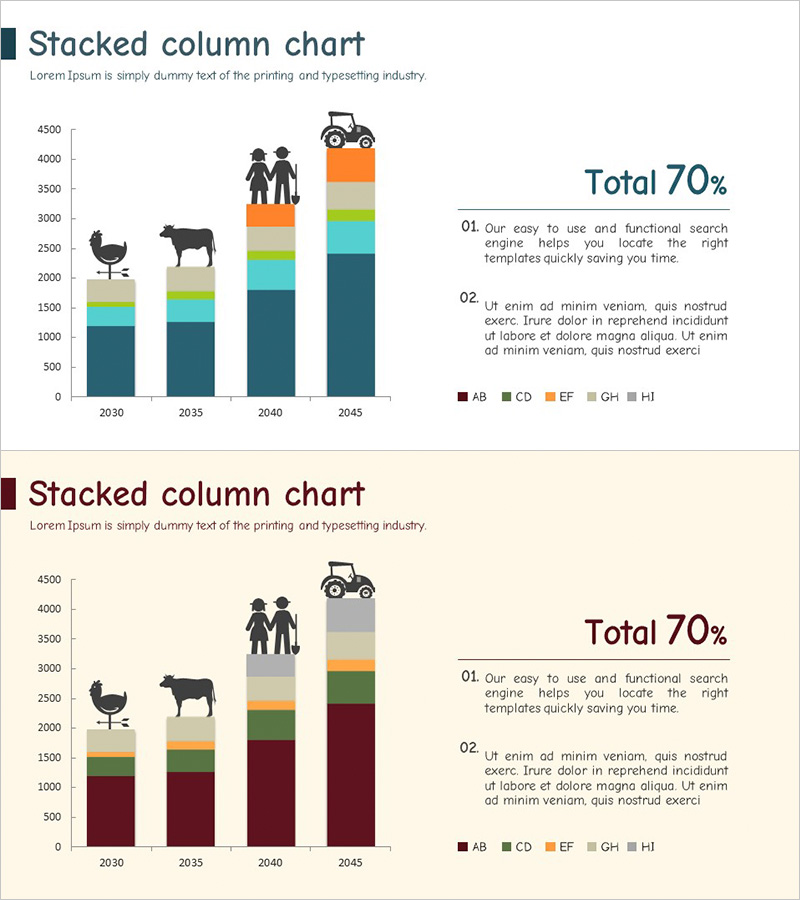
A stacked column chart PowerPoint slide designed for analyzing farm and livestock market trends. This presentation template visualizes data across four series (AB, CD, EF, GH, HI) from 2030 to 2045, enabling both cumulative value comparison and individual item analysis by color-coded categories. Farm animal silhouettes and agricultural machinery icons reinforce industry context, while the right-side text area accommodates key insights and interpretations. The 16:9 widescreen format with 2-slide composition integrates seamlessly into business presentations.
Usage Points
-
Main Usage
Compares multiple data points across years while displaying cumulative trends in a single visual. Ideal for expressing market size, market share, growth rates, and other composite indicators in agriculture, livestock, and food industry presentations.
-
How to Use
Input actual data into each year column (2030, 2035, 2040, 2045), and the color-coded series automatically stack. Complete the data-driven narrative by adding key insights, analysis, and strategic recommendations in the right-side text box and 'Total 70%' annotation area.
-
Recommended For
Recommended for business reports to executives and investors, industry analysis seminars, marketing strategy presentations, and market research findings. Ideal for agricultural, livestock, food, and distribution sector professionals, policymakers, and consultants supporting data-driven decision-making.
-
Slide Structure
2-slide composition. Each slide features a stacked column chart (4 years × 5 color-coded series), farm animal and machinery icons, right-side text area (title, description, statistics), and legend (AB, CD, EF, GH, HI). Optimized for 16:9 widescreen displays and projectors.
Related Products
-

Market Analysis with Horizontal and Vertical Bar Charts – Recent Trends Review
#Market and Competitor Analysis #Financial Plans and Performance #Diagram
-

Structure Presentation Template Segmented Vertical Bar Graph – Market Trends and Performance Analysis
#Market and Competitor Analysis #Financial Plans and Performance #Diagram
-

Changes in Crime Rates by Age Over Many Years – Insights from Data Analysis
#Market and Competitor Analysis #Graph #Future Outlook
-

Trend of Cargo Volume by Transportation Means – Market Trends Analysis
#Market and Competitor Analysis #Financial Plans and Performance #Diagram
