Carbon Neutral Sales and Profit Chart – Sustainable Management
RJ0600018_34
- Last Update 06/25/2025
- File Size 0.4MB
- # of Slides 2
- File Format PPTX
- Slide Ratio 16:9
- Color
Keywords
- #Content-Based Slides
- #Design-Based Slides
- #Market and Competitor Analysis
- #Financial Plans and Performance
- #Graph
- #Competitive Advantage
- #Sales and Revenue
- #Column
- #Grouped Column
- #16:9
- #combination chart PowerPoint
- #line and bar graph slide
- #sales profit analysis template
- #dual-series data visualization
- #financial chart slide
- #how to create combination chart in PowerPoint
About the Product
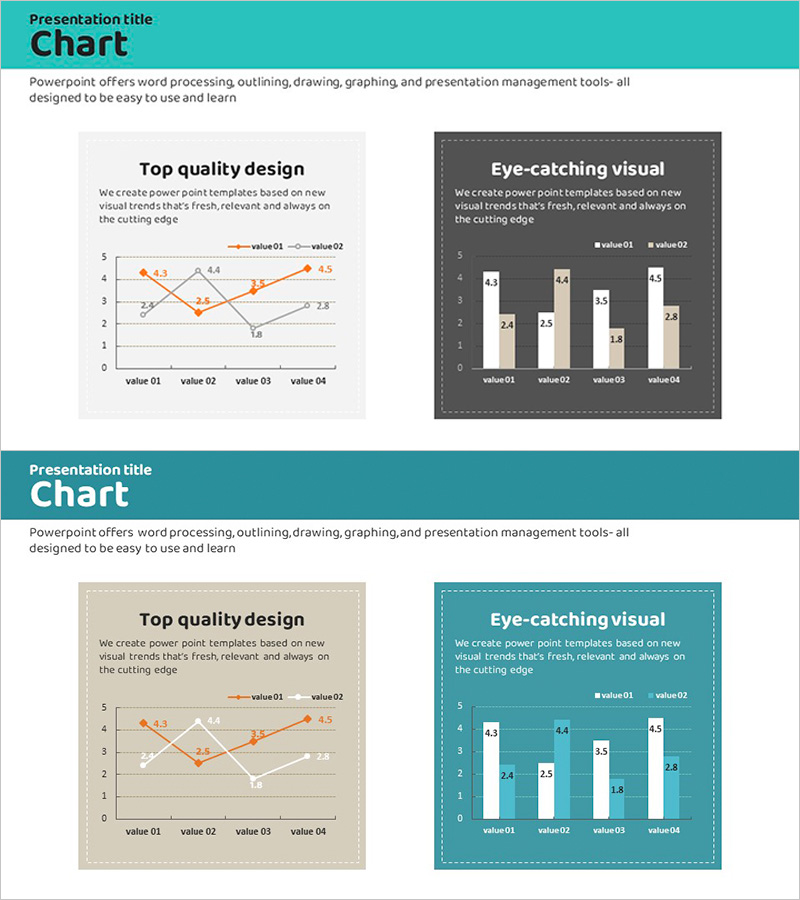
A 2-slide PowerPoint set that visualizes sales and profit data simultaneously using a hybrid chart combining line and bar graphs. This design effectively displays both trend lines and comparative values across four data points with two data series in orange and gray tones. Two design versions are included: a light-background slide for standard conference rooms and a dark-gray-background slide for high-contrast projection environments. The slides are fully editable in 16:9 widescreen PPTX format, compatible with all modern PowerPoint versions. Ideal for financial reports, business performance presentations, and sustainability management disclosures.
Usage Points
-
Main Usage
Communicate financial performance and business results by displaying sales trends and profit figures simultaneously. The line graph emphasizes trend changes while bars highlight absolute values, increasing credibility of decision-making data. Suitable for quarterly and annual financial reports, sustainability performance disclosures, and carbon-neutral business initiatives.
-
How to Use
Slide 1 features a light background with orange trend line and gray bars, ideal for standard meeting room presentations. Slide 2 uses a dark gray background with white and dark-tone bars and bright data labels, optimized for dimly lit environments and projector displays. Simply edit the data values and legend on each slide to input your actual sales and profit figures.
-
Recommended For
Finance teams presenting quarterly and annual results, CFO executive briefings, investor relations presentations, sustainability performance reports, financial forecast sections in business plans, and marketing performance analysis. Recommended for finance professionals, executives, and analysts in manufacturing, distribution, financial services, and energy sectors.
-
Slide Structure
2-slide set. Slide 1: Light background + orange line series (value 01) + gray bar series (value 02) + 4 data points (value 01–04) + legend. Slide 2: Dark gray background + white bars (value 01) + dark-tone bars (value 02) + same 4 data points + bright data labels. 16:9 widescreen format with fully editable shapes and text boxes.
Related Products
-

Visualizing Sales Performance with Column Chart – Presentation for Competitive Advantage
#Market and Competitor Analysis #Financial Plans and Performance #Graph
-

Analyze Sales Performance with Geometric Pattern Wide Bar Chart
#Market and Competitor Analysis #Financial Plans and Performance #Graph
-

Graph of Increase/Decrease in Meat Consumption – Market Analysis and Competitive Advantage
#Market and Competitor Analysis #Financial Plans and Performance #Graph
-

Analysis of Bakery and Seafood Market Trends with Bar and Column Charts
#Market and Competitor Analysis #Financial Plans and Performance #Graph
