Carbon Neutral Business Process Visualization – Brown Blue
RJ0600018_16
- Last Update 06/25/2025
- File Size 12.7MB
- # of Slides 2
- File Format PPTX
- Slide Ratio 16:9
- Color
Keywords
About the Product
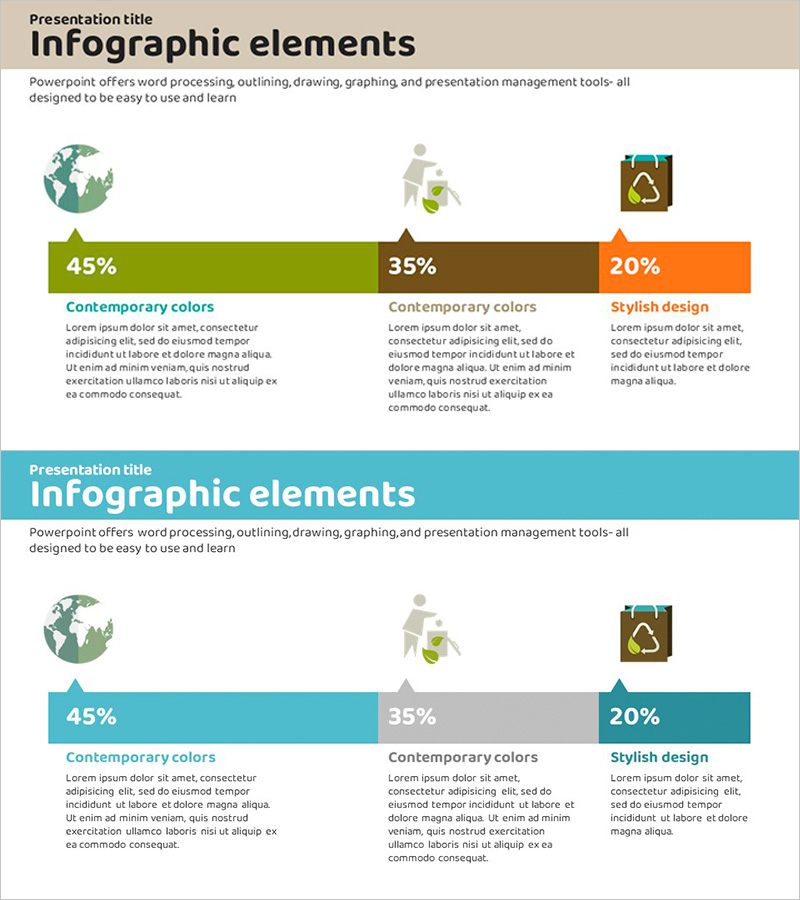
A PowerPoint slide designed for data comparison and infographic visualization with three-section percentage layout. This 2-slide set uses brown, blue, and orange color tones to present comparative data across three categories with icons, percentage values, and descriptive text areas. Ideal for market analysis, customer segmentation, budget allocation, and performance metrics. All elements are fully editable, allowing you to customize the content, colors, and text to match your presentation needs and corporate branding.
Usage Points
-
Main Usage
Effectively present comparative data across three categories using percentage-based visualization. The combination of icons and numerical values enhances audience comprehension and supports data-driven decision-making in business presentations.
-
How to Use
Edit the percentage values, icons, and descriptive text in each section to match your specific data. Maintain the color scheme while adjusting background colors and text formatting to align with your corporate branding and presentation style.
-
Recommended For
Recommended for marketing strategy presentations, business analysis reports, investor pitch decks, and executive briefings. Ideal for finance teams, marketing departments, and management-level presentations requiring data visualization and comparative analysis.
-
Slide Structure
Two-slide set featuring three-section comparison layout on each slide. Structured with title area at top, percentage bar chart in center, and descriptive text area at bottom for clear information hierarchy and visual balance.
Related Products
-

Camera Function Horizontal Bar Chart – Emphasizing Product Features Visually
#Product/Service Introduction #Graph #Other
-

Meat Positioning Map – Market and Consumer Analysis
#Product/Service Introduction #Marketing Plan and Strategy #Graph
-

Cosmetic Components Presentation Slide - Data and Design
#Product/Service Introduction #Market and Competitor Analysis #Graph
-

Syringe Shape Horizontal Bar Graph – Product/Service Introduction
#Product/Service Introduction #Graph #Other
