Cosmetic Components Presentation Slide - Data and Design
RJ0800039_14
- Last Update 08/10/2025
- File Size 0.2MB
- # of Slides 2
- File Format PPTX
- Slide Ratio 16:9
- Color
Keywords
- #Content-Based Slides
- #Design-Based Slides
- #Product/Service Introduction
- #Market and Competitor Analysis
- #Graph
- #Other
- #Features
- #Market Share
- #16:9
- #product components PowerPoint slide
- #cosmetic ingredients analysis presentation
- #comparison analysis slide
- #product introduction PPT design
- #market analysis PowerPoint template
About the Product
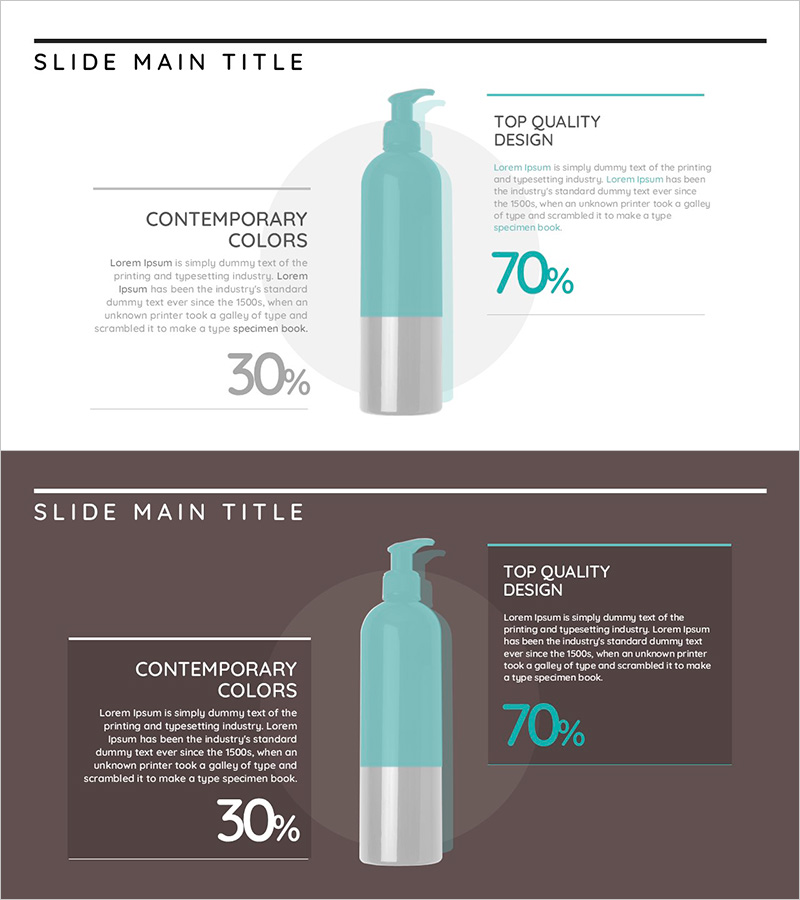
A PowerPoint slide designed to visually compare and analyze product components for cosmetics, detergents, beverages, and similar products. The layout features a transparent bottle illustration at the center, with descriptive text on the left side and percentage values on the right, creating a clear two-column information structure. Two background versions—light and dark—are included to suit different presentation environments and corporate branding. This PPTX format slide is compatible with all PowerPoint versions and ready for immediate use in product presentations, market analysis reports, and marketing proposals.
Usage Points
-
Main Usage
Designed to display and compare key product components and composition percentages at a glance. The transparent container illustration combined with percentage values effectively highlights product features and competitive advantages in cosmetics, food, beverages, and household products.
-
How to Use
Insert this slide into product introduction presentations, marketing proposals, and market analysis documents in the product characteristics section. Enter product names and ingredient names in the left text area, and composition percentages in the right numerical area. Choose between light or dark background versions based on your presentation environment and corporate branding.
-
Recommended For
Recommended for consumer goods companies (cosmetics, food, beverages, detergents) presenting product features, marketing teams conducting market analysis, sales teams preparing client proposals, and investor presentations. Suitable for any presentation scenario requiring quantitative product information.
-
Slide Structure
The slide consists of a title area at the top, a left-side text description box (3-4 lines) in the center, percentage value display on the right side, and a product illustration area in the upper right. Two color background versions (light and dark tones) are included for flexible presentation environment adaptation.
Related Products
-

Market Share Visualization of Three Countries – Effective Data Analysis
#Market and Competitor Analysis #Graph #Other
-

Lighting Graph – Market Share and Target Analysis
#Market and Competitor Analysis #Graph #Other
-

Donut Chart Slide Visualizing Crime Frequency by Region
#Market and Competitor Analysis #Graph #Other
-

Customer Share Analysis Chart – Insights for Successful Business
#Market and Competitor Analysis #Graph #Other
