Syringe Shape Horizontal Bar Graph – Product/Service Introduction
RJ0400031_6
- Last Update 05/26/2025
- File Size 7.9MB
- # of Slides 2
- File Format PPTX
- Slide Ratio 16:9
- Color
Keywords
About the Product
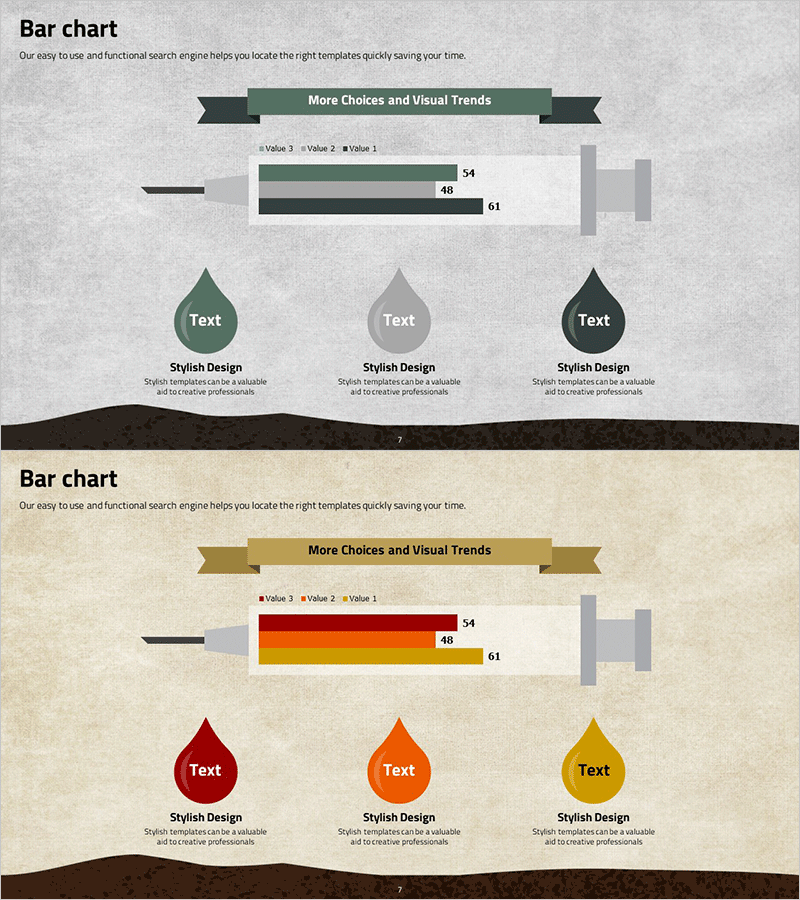
A specialized horizontal bar chart PowerPoint slide designed for product and service introduction presentations. The unique syringe-shaped design visualizes two data series with clear numerical values (48, 54, 61) and a harmonious green and black color palette that conveys professionalism. The slide features distinct input areas for immediate data entry and is fully compatible with 16:9 widescreen PPTX format. Ideal for comparing product performance metrics, service quality indicators, sales figures, and other quantitative information across multiple presentations.
Usage Points
-
Main Usage
Effectively communicates product and service performance metrics by comparing two data series side-by-side. The distinctive syringe shape increases visual engagement while maintaining a professional appearance, supporting credible, data-driven presentations to stakeholders.
-
How to Use
Simply input your actual data into the marked numerical fields (48, 54, 61) on each slide. Customize the legend labels (Value 1, Value 2, Value 3) to match your product attributes and adjust colors to align with your corporate brand identity. The 2-slide set allows for easy repetition when comparing multiple product categories.
-
Recommended For
Product marketing managers, sales presentation specialists, service quality reporting professionals, and executive presentation creators. Suitable for product brochures, marketing plans, business reports, investor pitch decks, and any presentation requiring quantitative comparative analysis.
-
Slide Structure
Two-slide layout featuring one syringe-shaped horizontal bar chart per slide. Each chart displays two data series (Value 1, Value 2) with a title area at the top and descriptive text space at the bottom. The three-color scheme (green, black, gray) clearly differentiates data layers and maintains visual hierarchy throughout.
Related Products
-

Camera Function Horizontal Bar Chart – Emphasizing Product Features Visually
#Product/Service Introduction #Graph #Other
-

Advantages of Learning Books and Smartphones – Effective Approaches
#Product/Service Introduction #Technical Approach #Text Box
-

Online Shopping Mall Composition Analysis Graph - Business Analysis and Technical Insights
#Business Introduction #Market and Competitor Analysis #Graph
-

Body Structure Description Diagram - Infographic Design
#Product/Service Introduction #Diagram #Other
