Environmental Protection Donut Chart – Market Share Visualization
RJ0600015_6
- Last Update 06/24/2025
- File Size 2.7MB
- # of Slides 2
- File Format PPTX
- Slide Ratio 16:9
- Color
Keywords
About the Product
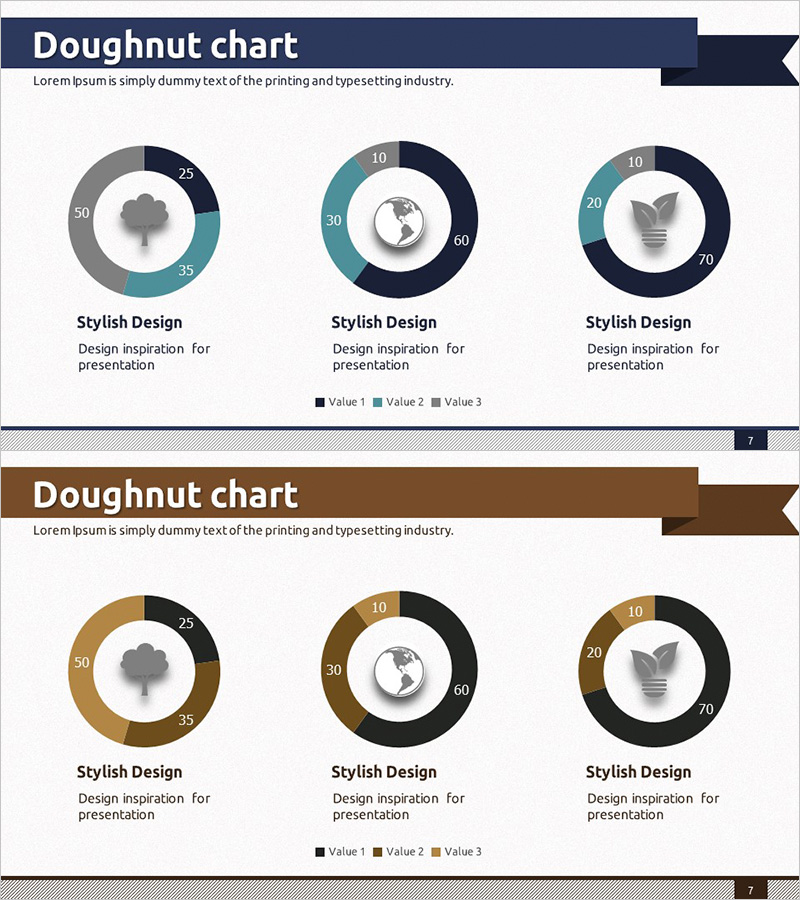
A 2-slide PowerPoint presentation set featuring donut charts that visualize 3-series data with clear ratio representation. The first version combines navy, gray, and teal colors, while the second version uses brown, black, and gold tones. Each slide displays three donut charts with centered icons (leaf, globe, lightbulb) to emphasize the theme, accompanied by numerical labels and legends for precise data communication. This presentation template effectively conveys market share, sales ratios, composition percentages, and other business metrics in professional settings.
Usage Points
-
Main Usage
Donut charts intuitively display the proportion of each item relative to the whole. The center space accommodates icons or text to emphasize the topic, while simultaneously comparing three data series. Optimized for business data visualization including market analysis, sales performance, and customer composition reporting.
-
How to Use
Insert this slide in the analysis or results section of your presentation when explaining data proportions. The chart is designed to automatically reflect ratio changes when you input numerical values. Use the navy or brown version based on your presentation theme and background color. Legends clearly distinguish each data series for audience comprehension.
-
Recommended For
Recommended for executives, planners, analysts, and marketing professionals preparing executive reports, business plans, marketing strategies, investor pitch decks, and quarterly performance reports. Particularly suitable for finance, sales, and customer analysis sections where ratio comparison is critical to decision-making.
-
Slide Structure
Slide 1: Three donut charts in navy, gray, and teal with centered icons (leaf, globe, lightbulb), numerical labels, and legend. Slide 2: Three donut charts in brown, black, and gold with identical structure. 16:9 widescreen format, PPTX file, 2-slide composition.
Related Products
-

Visualizing Market Share with Watercolor Donut Chart
#Market and Competitor Analysis #Graph #Market Share
-

Red Sky Donut Chart – Market Share Analysis
#Company Introduction #Market and Competitor Analysis #Graph
-

Travel Guide Business Goal Market Strategy Donut Chart – Market Share Analysis
#Market and Competitor Analysis #Marketing Plan and Strategy #Graph
-

Bottled Beer Donut Chart – Market Share Visualization
#Market and Competitor Analysis #Marketing Plan and Strategy #Graph
