Camping Market Research and Statistics Infographic Slide
RJ0600014_10
- Last Update 06/24/2025
- File Size 1.1MB
- # of Slides 2
- File Format PPTX
- Slide Ratio 16:9
- Color
Keywords
- #Content-Based Slides
- #Design-Based Slides
- #Market and Competitor Analysis
- #Graph
- #Competitive Advantage
- #Line
- #Bell Curve
- #16:9
- #area chart PowerPoint
- #area graph slide template
- #market research data visualization
- #camping market infographic
- #trend analysis presentation
- #how to create area chart in PowerPoint
About the Product
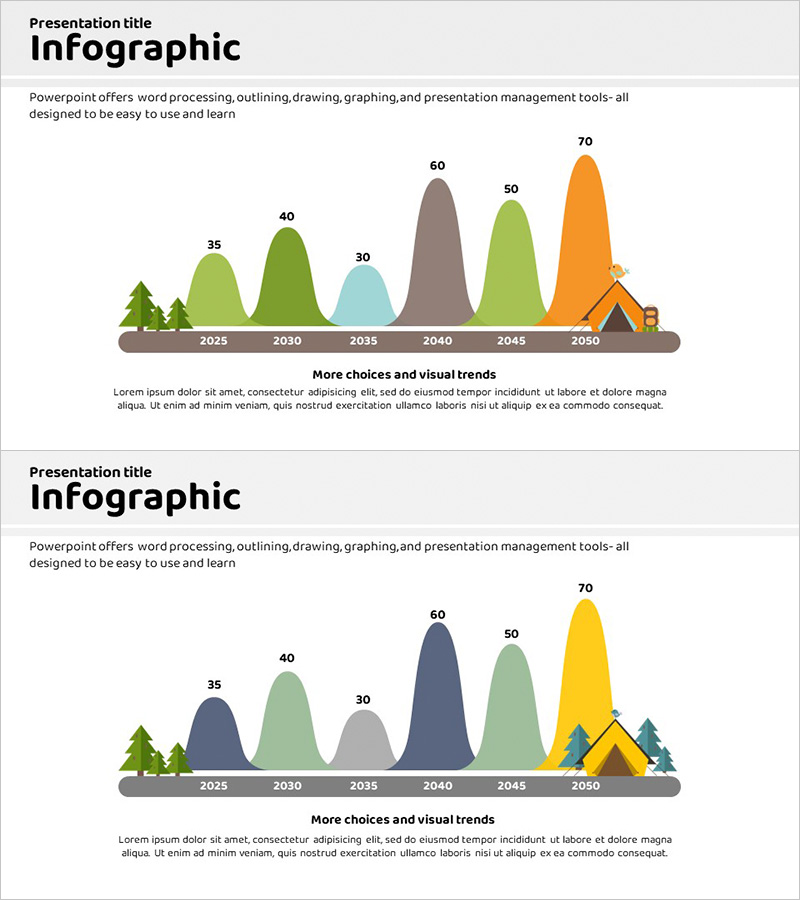
A PowerPoint slide set visualizing camping market research and statistics through an area chart design. This presentation template displays market size changes from 2025 to 2050 across seven data points (35, 40, 30, 60, 50, 70), enabling clear year-over-year trend comparison. The area chart uses multiple colors—orange, green, gray, and blue—to distinguish data series and illustrate cumulative market evolution over time. Ideal for market analysis reports, investment pitch decks, business proposals, and strategic presentations requiring data-driven insights. Provided in 16:9 aspect ratio PPTX format with fully editable elements for immediate customization and deployment.
Usage Points
-
Main Usage
Display camping industry market size evolution, year-over-year growth trends, and multi-series cumulative data comparison in a single visual. The area chart's stacked regions represent each data series magnitude, while color differentiation ensures clear series identification and professional data communication.
-
How to Use
Insert into market research reports, investment pitch decks, and business proposals within the market analysis section to visually demonstrate camping market growth potential and opportunity. Replace year and value data with your own figures to create customized analysis materials aligned with your business context.
-
Recommended For
Marketing professionals, market analysts, investment managers, business strategists, and consultants requiring data-driven decision support. Particularly valuable for camping industry companies, tourism businesses, leisure sector enterprises, and organizations presenting market expansion strategies.
-
Slide Structure
Two-slide set, each displaying 2025–2050 market size data across seven years using area chart visualization. Slide 1 features orange, green, and gray color palette; Slide 2 offers blue, green, and yellow tones, allowing design flexibility to match your presentation theme and corporate branding.
Related Products
-

Visualizing Health Trends with Smart Watch – Innovation and Management
#Market and Competitor Analysis #Graph #Competitor Analysis
-

Bar Chart Visualizing Coffee Sales Trends - Insights through Messaging
#Market and Competitor Analysis #Financial Plans and Performance #Graph
-

Travel App Competitor Analysis Vertical Bar Chart
#Market and Competitor Analysis #Graph #Competitor Analysis
-

Vegetable Market Status Analysis with Line Charts
#Market and Competitor Analysis #Graph #Market Status
