Visualizing Health Trends with Smart Watch – Innovation and Management
RJ0400043_19
- Last Update 05/28/2025
- File Size 0.9MB
- # of Slides 2
- File Format PPTX
- Slide Ratio 16:9
- Color
Keywords
- #Content-Based Slides
- #Design-Based Slides
- #Market and Competitor Analysis
- #Graph
- #Competitor Analysis
- #Competitive Advantage
- #Line
- #Bell Curve
- #16:9
- #bell curve graph PowerPoint
- #health data visualization slides
- #smart watch presentation template
- #trend analysis chart PPT
- #wearable technology PowerPoint slide
About the Product
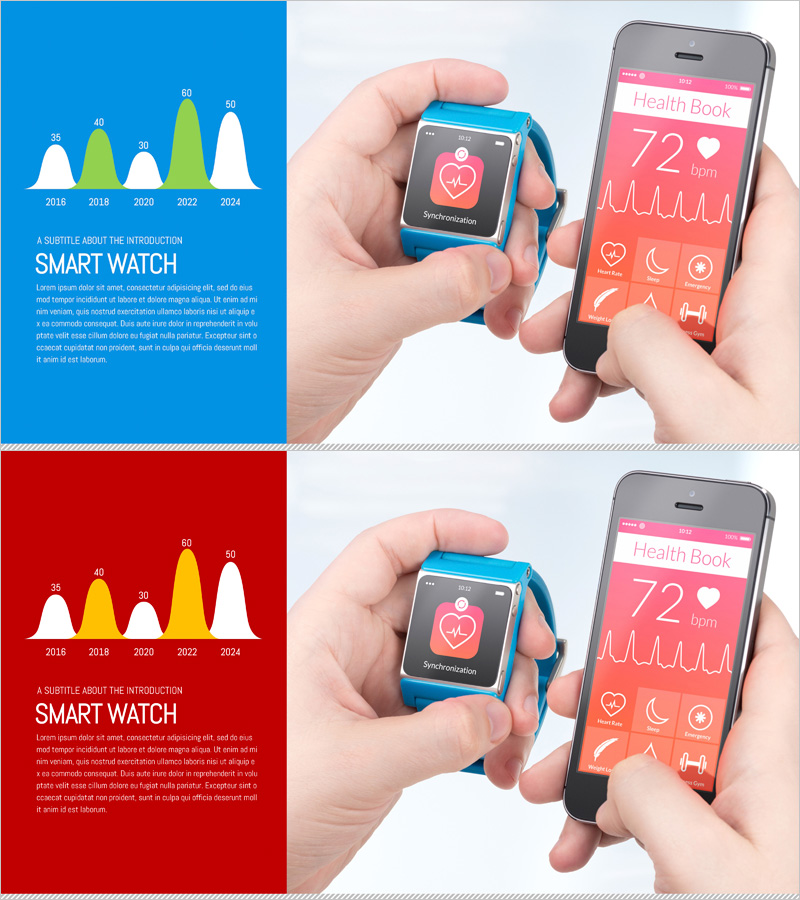
A PowerPoint slide set visualizing smart watch health trends using a bell curve graph design. Displays data progression from 2016 to 2024 with dual background options in blue and red to match your presentation tone. Each slide integrates smart watch device mockups and mobile health app interfaces showing heart rate, sleep, and fitness metrics. Delivered in 16:9 widescreen PPTX format with full editing capability. Ideal for product launches, healthcare reports, technology presentations, and market analysis decks.
Usage Points
-
Main Usage
Illustrates user adoption and health metric growth trends for smart watch and wearable devices using a bell curve distribution. Conveys data-driven credibility for product introductions, market analysis, quarterly performance reports, and healthcare technology presentations.
-
How to Use
Select background color (blue or red) to match your presentation theme. Replace graph values with actual company data and substitute device mockups and app interface screenshots with your product visuals. Customize text descriptions for technology briefings, investor pitches, or health sector seminars.
-
Recommended For
Product marketing managers at IT and healthcare companies, data analysts, technology strategists, investment pitch presenters, wearable device manufacturers, healthcare consultants, and medical seminar instructors.
-
Slide Structure
Two-slide composition: Slide 1 features blue background with bell curve graph showing five data points (2016–2024) and descriptive text. Slide 2 uses red background with identical graph, smart watch device mockup, and mobile health app interface displaying heart rate, sleep tracking, and exercise data.
Related Products
-

Carbon Neutral Competitive Advantage Horizontal Chart
#Market and Competitor Analysis #Graph #Competitor Analysis
-

Eco-friendly Icon Bar Graph Slide
#Market and Competitor Analysis #Diagram #Graph
-

Farm Donut Chart Blue Green – Market Competitive Analysis
#Market and Competitor Analysis #Graph #Competitor Analysis
-

Future Travel Competitor Market Forecast Blue Green
#Market and Competitor Analysis #Graph #Competitor Analysis
