Cartoon Theme Area Type Future Outlook Graph
RJ0300072_24
- Last Update 05/08/2025
- File Size 0.4MB
- # of Slides 2
- File Format PPTX
- Slide Ratio 16:9
- Color
Keywords
About the Product
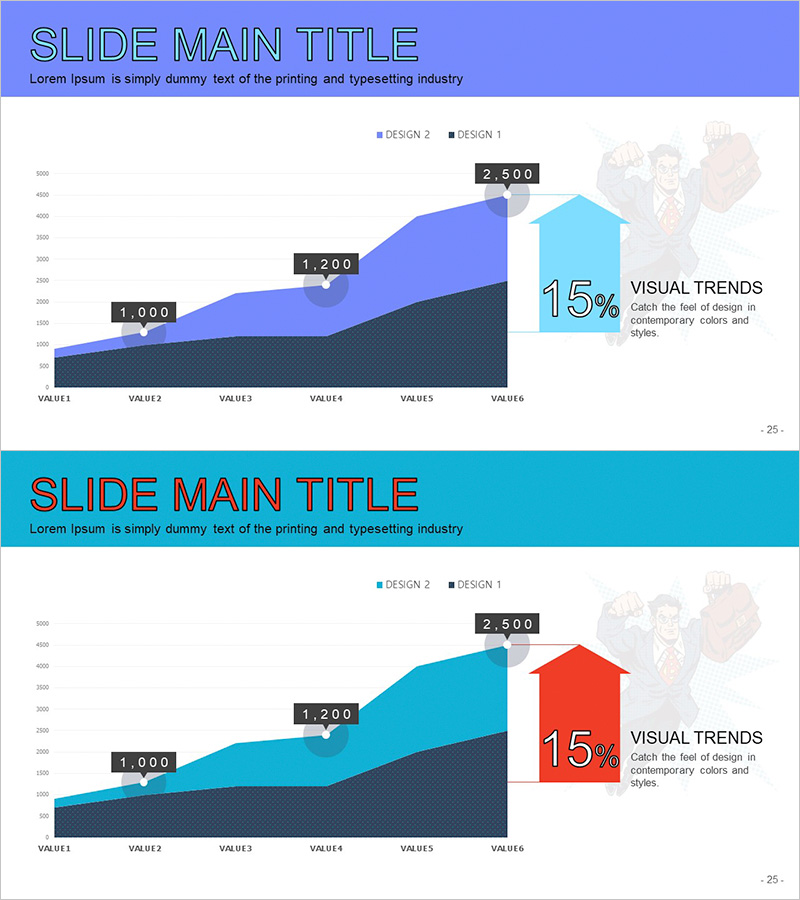
A cartoon-themed area chart PowerPoint slide designed to visualize market trends and future outlook with clarity and visual appeal. The slide features a two-color stacked area chart in blue and dark navy, displaying data progression across six time intervals (1,000 to 2,500) with clear numerical labels. A dedicated 'VISUAL TRENDS' insight box on the right highlights key metrics (15% growth rate) with supporting illustration, making data-driven narratives more engaging. The bright, approachable cartoon aesthetic combined with professional data visualization makes this slide ideal for business presentations, investor pitches, and market analysis reports. Fully editable title, legend, and annotation areas allow quick customization for your specific data and messaging.
Usage Points
-
Main Usage
Communicate market size evolution, business growth trajectory, and future projections through a stacked area chart that compares two data categories over time. The two-color structure (blue and dark navy) enables clear differentiation between segments, while the 'VISUAL TRENDS' box emphasizes critical metrics such as growth rates or target values, supporting evidence-based decision-making.
-
How to Use
Insert this slide into business plans, investor presentations (IR decks), or market analysis reports in the 'Market Overview' or 'Future Outlook' section. Replace the legend labels and axis values with your actual data, then update the 'VISUAL TRENDS' text and percentage figure with your key insight. The cartoon tone works especially well for tech companies, startups, and marketing-focused presentations.
-
Recommended For
Marketing managers, business strategists, investor relations professionals, market analysts, and startup founders who need to present data-driven growth narratives. Suitable for visualizing market size trends, customer acquisition curves, revenue growth, market share evolution, and other time-series business metrics.
-
Slide Structure
The slide comprises a title section (main heading + subtitle text), a central stacked area chart with six data points and dual-color fill, a legend, and a right-aligned insight box featuring a percentage highlight, descriptive text, and background illustration. Four editable text zones (title, subtitle, legend, insight) provide flexibility for customization across different business contexts.
Related Products
-

National Trend Change Graph Visualization – Horizontal Bar Chart
#Market and Competitor Analysis #Graph #Other
-

Market Trends & Future Outlook Graph – An Intuitive Presentation Template
#Market and Competitor Analysis #Graph #Other
-

Graphs that draw a successful future outlook – Visualizing Market Trends
#Market and Competitor Analysis #Graph #Other
-

Childbirth Age Comparison Analysis Graph – Market Status and Forecast
#Market and Competitor Analysis #Graph #Other
