Marketing Trends Graph – Market Analysis and Performance
RJ0600011_23
- Last Update 06/23/2025
- File Size 1.1MB
- # of Slides 2
- File Format PPTX
- Slide Ratio 16:9
- Color
Keywords
- #Content-Based Slides
- #Design-Based Slides
- #Market and Competitor Analysis
- #Financial Plans and Performance
- #Graph
- #Market Overview
- #Sales and Revenue
- #16:9
- #marketing trends graph PowerPoint
- #line chart presentation slide
- #performance metrics visualization PPT
- #marketing performance analysis slide
- #market analysis graph presentation
About the Product
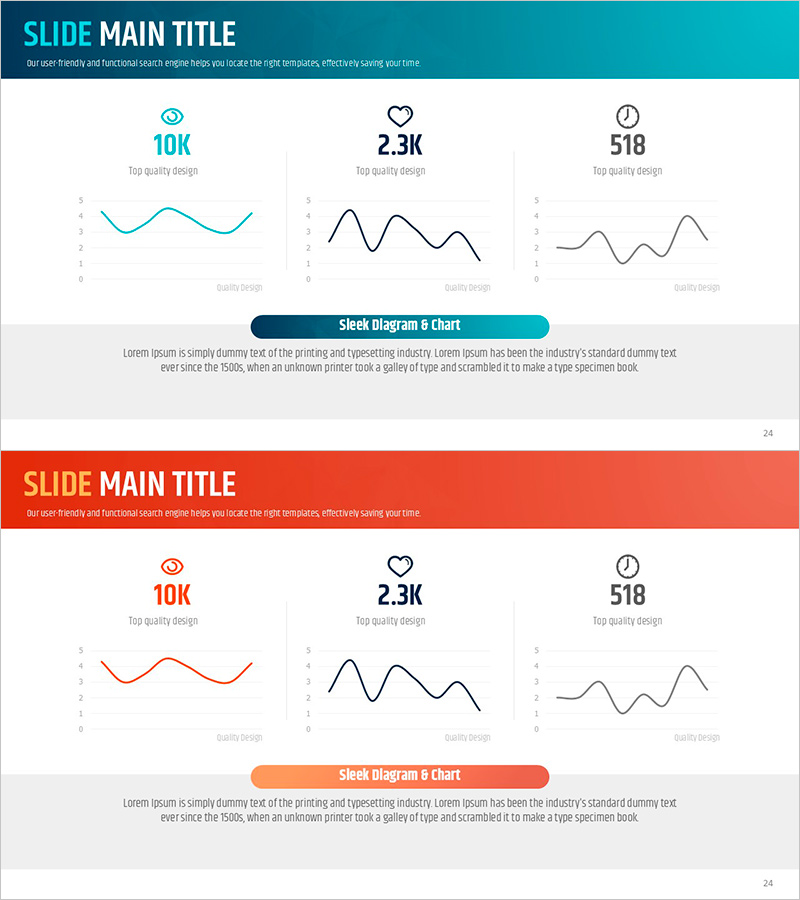
A 2-slide PowerPoint presentation template for visualizing marketing performance and market analysis data. This slide deck features three line charts that compare metrics over time, enabling effective communication of performance indicators in business presentations. Available in two design variations with teal and orange header backgrounds, each slide displays numerical data (10K, 2.3K, 518) alongside trend graphs. Ideal for marketing reports, quarterly performance reviews, market analysis presentations, and investor pitches. Fully editable PowerPoint template ready for immediate use.
Usage Points
-
Main Usage
Display marketing campaign performance metrics (views, engagement, time) as trend lines to show market response and performance trajectory at a glance. Supports data-driven decision-making in quarterly reports, investor presentations, and executive briefings.
-
How to Use
Insert into the performance analysis section of marketing reports to communicate campaign effectiveness through both numbers and visual trends. Replace chart legends and values with your own data, and adjust background colors (teal or orange) to match your brand identity. Suitable for quarterly and annual performance presentations.
-
Recommended For
Marketing managers, performance analysts, executives, and investor relations professionals presenting campaign effectiveness, market response, and customer engagement metrics. Particularly useful for digital marketing results, social media campaign analysis, and advertising ROI reports.
-
Slide Structure
Two-slide format with consistent layout: title area at top, three line charts with icons and metrics in the center, and descriptive text area at bottom. First slide features teal header, second features orange header for visual variety. Each chart is independently editable and can be customized with your data.
Related Products
-

Production Cost Variance Analysis Chart – Visualizing Financial Performance
#Financial Plans and Performance #Diagram #Graph
-

Sales Outlook Table & Bar Chart – Market and Financial Insights
#Market and Competitor Analysis #Financial Plans and Performance #Diagram
-

Key Sales Analysis Donut Chart – Visualizing Financial Performance
#Financial Plans and Performance #Graph #Other
-

Fantastic Donut Chart – A Slide for Effective Market Analysis
#Market and Competitor Analysis #Financial Plans and Performance #Graph
