Ranking of Popularity Vote on the Menu – Visualized with Horizontal Bar Chart
RJ0800013_10
- Last Update 08/03/2025
- File Size 0.4MB
- # of Slides 2
- File Format PPTX
- Slide Ratio 16:9
- Color
Keywords
- #Content-Based Slides
- #Design-Based Slides
- #Market and Competitor Analysis
- #Financial Plans and Performance
- #Graph
- #Competitive Advantage
- #Sales and Revenue
- #Column
- #Column Chart
- #16:9
- #horizontal bar chart PowerPoint
- #ranking comparison slide template
- #5-item bar graph
- #popularity analysis chart
- #data visualization PowerPoint slide
About the Product
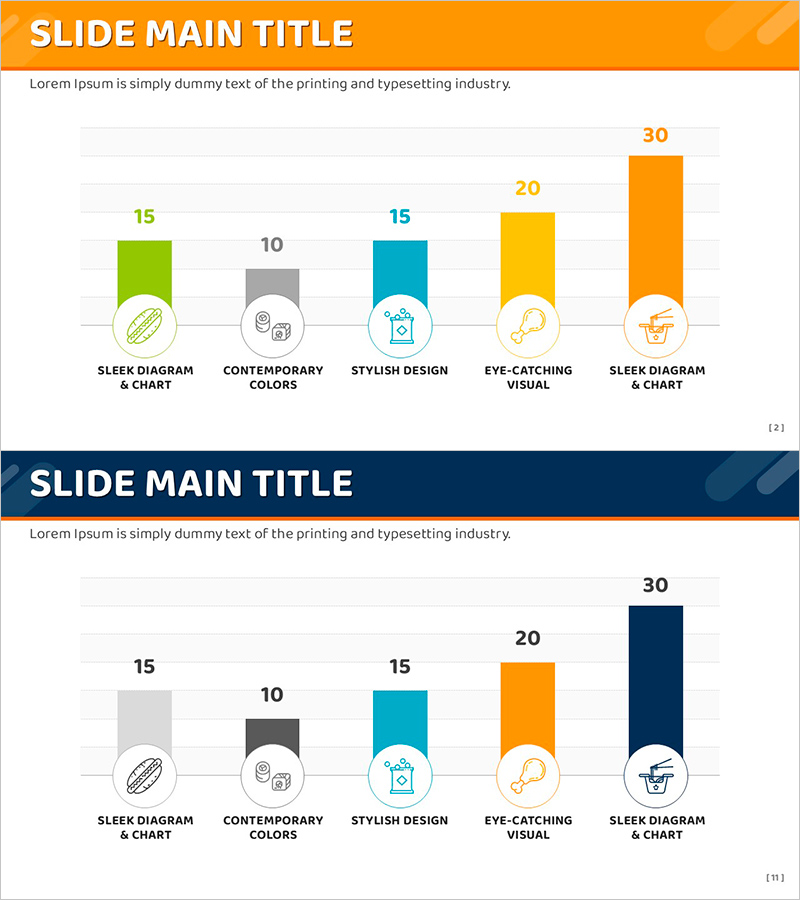
A PowerPoint slide template featuring a 5-item horizontal bar chart for visualizing ranking data such as menu popularity votes, product preferences, and sales comparisons. Each bar is color-coded in orange, yellow, cyan, gray, and green, with numeric labels and icons positioned for maximum clarity. Delivered in 16:9 widescreen PPTX format with 2 slides, ready for immediate data entry into presentations, reports, and business proposals. The horizontal bar layout accommodates longer item names while enabling quick comparative analysis across all categories.
Usage Points
-
Main Usage
Designed to compare and visualize ranking data such as product popularity, customer preferences, and sales performance across five categories. The horizontal bar structure allows viewers to instantly grasp relative magnitude differences and identify top performers at a glance.
-
How to Use
Simply replace the bar values and item labels with your own data. Icons can be swapped to match your category, and colors are fully customizable to align with corporate branding. Apply directly to marketing reports, sales analysis presentations, and customer survey result announcements.
-
Recommended For
Marketing teams analyzing product preferences, sales teams comparing performance metrics, planning teams presenting customer voting results, executive reports requiring ranking visualization, and educational seminars sharing survey findings.
-
Slide Structure
Two-slide layout with consistent design: orange header section at top containing title, white content area below with 5 horizontal bars arranged in sequence. Each bar displays an icon on the left, numeric value on the right, and uses distinct color coding. Second slide features dark blue header background while maintaining identical bar chart structure and data layout.
Related Products
-

Car Wide Template Vertical Bar Graph – Market Analysis and Competitive Advantage
#Market and Competitor Analysis #Financial Plans and Performance #Graph
-

India Travel Vertical Bar Graph – Visual Appeal of Green and Red
#Market and Competitor Analysis #Financial Plans and Performance #Graph
-

Bar Chart Slide for Current Status of Traditional Temples
#Market and Competitor Analysis #Financial Plans and Performance #Graph
-

Typographic Wide Template Bar Chart & Table – Competitive Analysis and Performance
#Market and Competitor Analysis #Financial Plans and Performance #Diagram
