Process Timeline and Resource Table – Optimizing Operational Plans
RB0100036_7
- Last Update 03/05/2025
- File Size 0.4MB
- # of Slides 2
- File Format PPTX
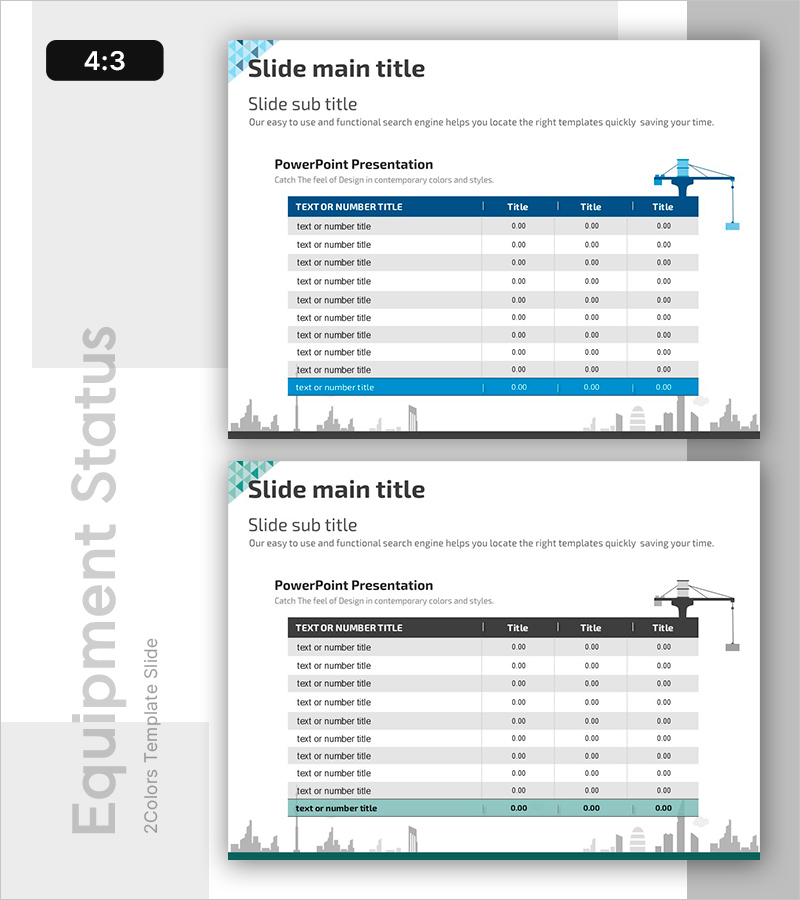
- Slide Ratio 4:3
- Color
Keywords
- #Content-Based Slides
- #Design-Based Slides
- #Operational Plan
- #Diagram
- #Capital Investment Plan
- #Organizational Structure and Staffing Plan
- #Table
- #Standard Table
- #4:3
- #data table PowerPoint slide
- #operational plan template
- #9-row table slide
- #business data table design
- #PowerPoint table template
- #how to create data table in PowerPoint
About the Product
A 9-row data table PowerPoint slide designed for visualizing operational plans and resource allocation. Features a dark blue header row with alternating white and light gray rows to maximize information readability. The right side includes a crane icon symbolizing project progress, while the bottom cityscape background reinforces business presentation context. The 4-column structure efficiently organizes item names and three numerical data fields. Two-slide set provides an alternative layout with teal header for section differentiation within documents.
Usage Points
-
Main Usage
Organize and present quantitative data such as operational plans, resource allocation, schedules, and performance metrics. The blue header emphasizes credibility and professionalism, while alternating row colors ensure readability even with large datasets.
-
How to Use
The two-slide set features a blue header version and a teal header version for section or topic differentiation. Simply edit cell text and numerical values to input your actual data for immediate use in presentations.
-
Recommended For
Project managers, operations specialists, financial analysts, and consultants preparing meeting materials, business reports, proposals, and strategic plans that require data-driven decision support.
-
Slide Structure
9 rows × 4 columns table layout with dark blue header row containing text or numeric titles. Rows 2–9 alternate between white and light gray backgrounds for visual distinction. Crane icon in upper right and cityscape silhouette at bottom reinforce business context.
Related Products
-

Support Plan and Analysis Table for Operational Planning
#Operational Plan #Financial Plans and Performance #Diagram
-

Office Interior Enhancing Work Efficiency Slide
#Operational Plan #Market and Competitor Analysis #Diagram
-

Facility Capacity and Utilization Chart – Emphasizing Operational Efficiency
#Business Introduction #Operational Plan #Diagram
-

Facility Management Plan Chart – Optimizing Operations and Investments
#Operational Plan #Diagram #Capital Investment Plan
