Sleek Graph Chart for Data Visualization – Contemporary Colors
RJ0300080_21
- Last Update 05/11/2025
- File Size 0.2MB
- # of Slides 2
- File Format PPTX
- Slide Ratio 16:9
- Color
Keywords
About the Product
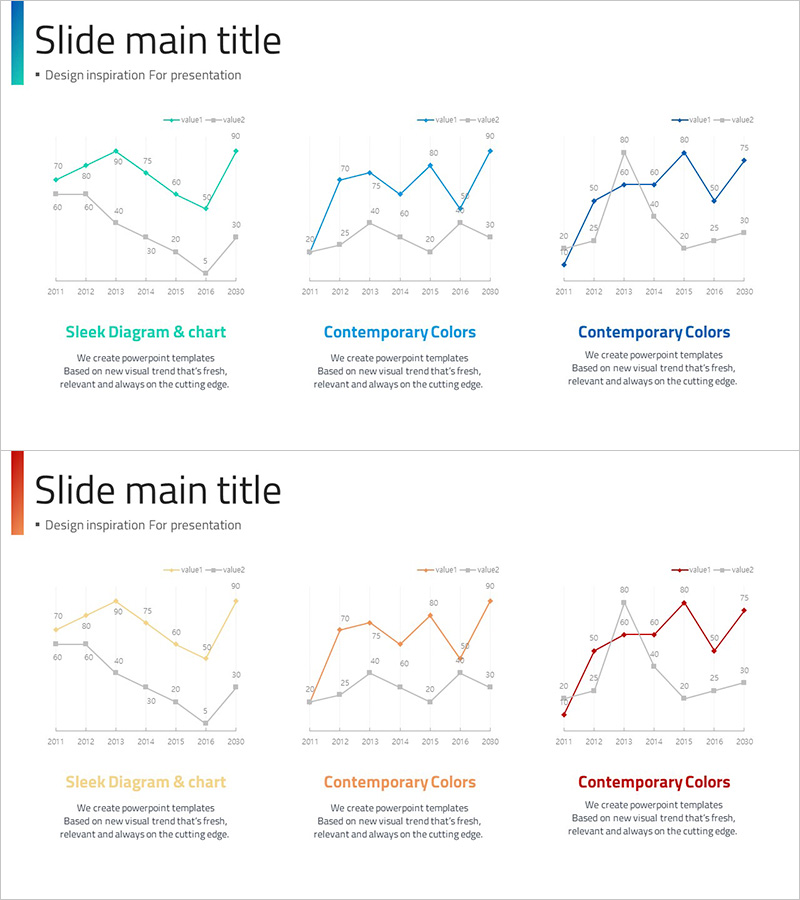
A professional line chart PowerPoint slide designed to visualize year-over-year data trends and compare multiple data series simultaneously. This presentation template features three color variations—blue, orange, and red—each displaying two data series from 2011 to 2020 with precise numerical labels at every data point. The 16:9 widescreen format includes 2 slides ready for immediate customization. Perfect for presenting sales trends, growth rates, market performance, and other time-series analytics in business reports and executive presentations.
Usage Points
-
Main Usage
Visualize time-series data changes and compare two or more data sets across multiple years or periods. Ideal for presenting sales performance, revenue growth, market share evolution, and other quantitative metrics that require trend analysis.
-
How to Use
Insert your actual data values into the chart by editing the data table in PowerPoint. Customize the legend labels, axis titles, and color scheme to match your brand guidelines. Use in financial reports, quarterly business reviews, investor presentations, and performance analysis meetings.
-
Recommended For
Finance professionals, business analysts, marketing managers, consultants, academic researchers, and executives who need to communicate quantitative trends and comparative performance metrics. Suitable for any presentation requiring clear visualization of historical data patterns and growth trajectories.
-
Slide Structure
Each slide contains two independent line charts, each displaying dual data series (blue-gray, orange-gray, or red-gray combinations). The X-axis represents years 2011-2020, the Y-axis ranges from 0-80, and all data points include numerical labels for precise information delivery.
Related Products
-

Default Line Graph for Market & Competitor Analysis – Competitive Advantage
#Market and Competitor Analysis #Graph #Competitor Analysis
-

Desperate Stock Price Decline Graph – The Tragedy of Market Analysis
#Market and Competitor Analysis #Graph #Competitor Analysis
-

Competition Graphs and Analysis – Slides for Market Advantage
#Market and Competitor Analysis #Graph #Competitor Analysis
-

Curved Gradient Line Graph – Market and Competitor Analysis
#Market and Competitor Analysis #Graph #Competitor Analysis
