Market Analysis Horizontal Bar Graph
RJ0600009_6
- Last Update 06/23/2025
- File Size 4.9MB
- # of Slides 2
- File Format PPTX
- Slide Ratio 16:9
- Color
Keywords
About the Product
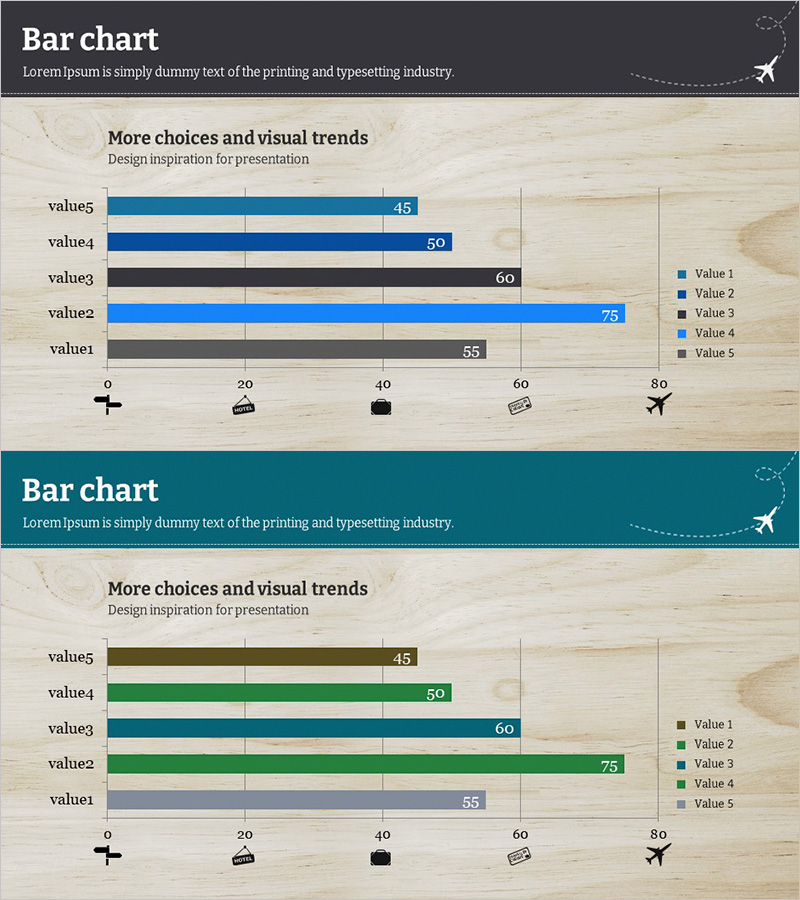
A horizontal bar chart PowerPoint slide designed to visualize market trends and competitive analysis at a glance. Five data items are arranged side-by-side to display performance metrics, market share, sales volume, and growth rates in an intuitive format. The multi-color bars in gray, black, and blue tones distinguish data series, while gridlines and numeric labels ensure accurate data interpretation. This 2-slide presentation template is ready to use across various business contexts and reporting scenarios.
Usage Points
-
Main Usage
Compare five data points such as market trends, competitor performance, sales volume, and market share using horizontal bars to clearly convey relative magnitude and ranking at a glance.
-
How to Use
Use in sales reports, market analysis presentations, and business proposals to explain market conditions and competitive landscape. The bar length provides intuitive comparison while labeled values ensure accuracy and credibility.
-
Recommended For
Marketing managers, sales directors, business analysts, and executives presenting market overview and competitive positioning to stakeholders and decision-makers.
-
Slide Structure
Five items (value1–value5) displayed as horizontal bars spanning 0–80 on the x-axis, with color-coded series in gray, black, and blue tones. Gridlines at 20-unit intervals and numeric labels (45–75) support precise data reading, while legend and icons provide contextual reinforcement.
Related Products
-

Latest Trend Analysis Bar & Donut Charts
#Market and Competitor Analysis #Graph #Market Analysis
-

Service Market Trends and Analysis Slide (Red and Blue)
#Market and Competitor Analysis #Diagram #Graph
-

Market Analysis Template with Line Graphs and Horizontal Bar Charts
#Market and Competitor Analysis #Graph #Market Analysis
-

Chart of Industry Change and Global Market Outlook Analysis
#Market and Competitor Analysis #Graph #Market Analysis
