Projected Investment Returns Graph – Visualized in Blue Green Linear Flow
RJ0600009_17
- Last Update 06/23/2025
- File Size 4.9MB
- # of Slides 2
- File Format PPTX
- Slide Ratio 16:9
- Color
Keywords
About the Product
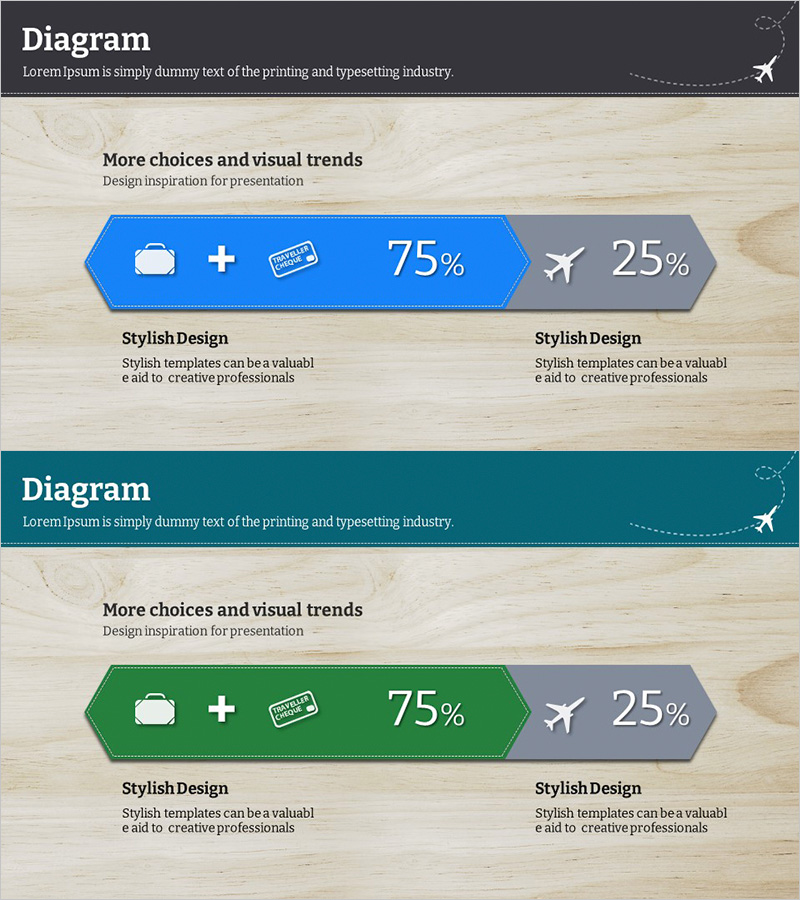
A hexagon-shaped linear diagram PowerPoint slide designed to visualize investment return projections and business performance comparisons. Two hexagon shapes in blue and green dual-tone colors are positioned left and right to represent a two-stage flow, with editable areas for icons, text, and numerical data in each section. Available in 16:9 widescreen format with 2 slides, this presentation template is ready to use for financial reports, investment proposals, performance analysis, and ROI visualization in business decks.
Usage Points
-
Main Usage
Visualize and compare two key metrics such as projected investment returns, business performance indicators, or goal achievement rates. The left blue hexagon and right green hexagon create a clear visual distinction that directs audience attention to the comparison and emphasizes the relationship between the two data points.
-
How to Use
Insert icons, text labels, and numerical values into each hexagon section to define your comparison items. During presentation, explain the progression from the left item to the right item, or use the layout to contrast advantages and disadvantages of two options. The color scheme and hexagon shapes remain fixed while text and data fields are fully editable.
-
Recommended For
Finance professionals, business planners, investment managers, and marketing specialists preparing executive reports, investor pitch decks, quarterly performance reviews, and business proposals. Ideal for any presentation requiring side-by-side data comparison or two-stage process visualization.
-
Slide Structure
2-slide set. Each slide features a left blue hexagon (with icon placeholder, text area, and numerical field) and a right green hexagon (identical structure), connected by a linear flow element. Wood texture background provides a professional appearance suitable for corporate presentations.
Related Products
-

Linear Diagram Slide for Business Service Differentiation Strategy
#Product/Service Introduction #Diagram #Graph
-

Customer and Service Analysis and Strategy – Data-Driven Approach
#Market and Competitor Analysis #Marketing Plan and Strategy #Diagram
-

Market Competitiveness Comparison Positioning Map – Marketing Strategy and Analysis
#Marketing Plan and Strategy #Diagram #Graph
-

Competitive Market Positioning Analysis Chart - Essential for Marketing Strategy
#Marketing Plan and Strategy #Diagram #Graph
