Direction of Fintech Business Promotion – Clearly Illustrated with Linear Flow
RJ0400058_20
- Last Update 06/02/2025
- File Size 0.1MB
- # of Slides 2
- File Format PPTX
- Slide Ratio 16:9
- Color
Keywords
- #Content-Based Slides
- #Design-Based Slides
- #Product/Service Introduction
- #Business Strategy
- #Diagram
- #Graph
- #Other
- #Differentiation Strategy for Products/Services
- #Business Direction
- #Flow
- #Linear Flow
- #16:9
- #linear flow diagram PowerPoint
- #4-stage process flow slide
- #business promotion template
- #arrow diagram PPT
- #process flow chart PowerPoint
About the Product
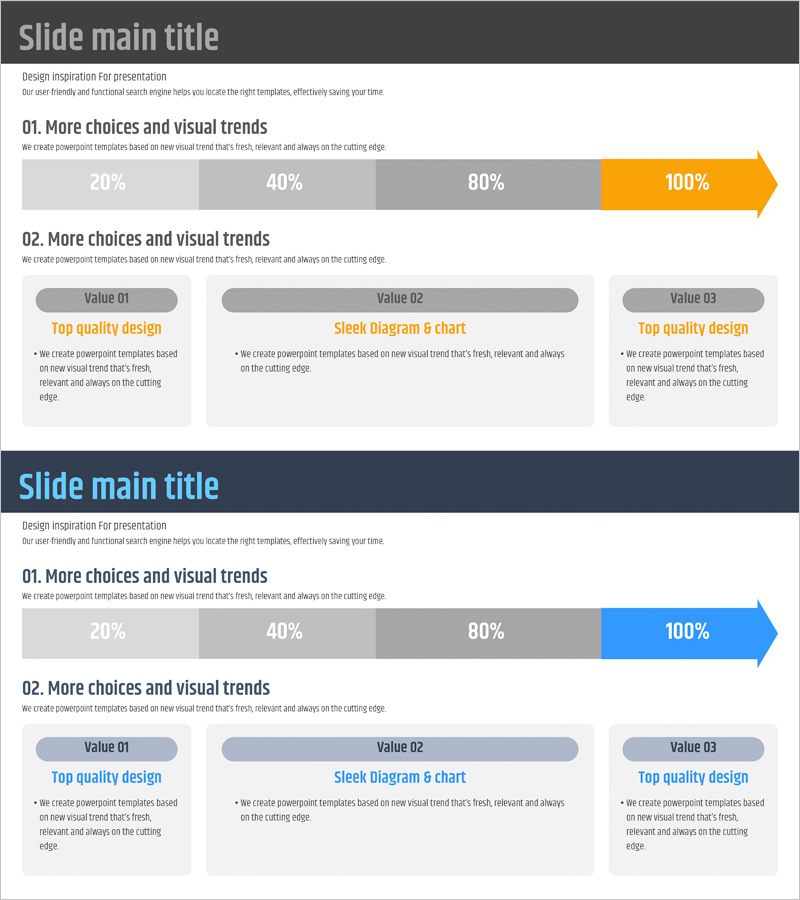
A PowerPoint slide template that clearly illustrates fintech business promotion direction through a 4-stage linear flow diagram. The diagram progresses from left to right with arrow-shaped nodes representing each stage, allowing you to input stage objectives and strategic milestones sequentially. The design features a gray background with an orange accent arrow highlighting the final stage, and each node includes percentage indicators and text input areas. This presentation template is ideal for visualizing business processes, project phases, strategic roadmaps, and implementation timelines in corporate presentations and investor pitches.
Usage Points
-
Main Usage
Illustrate business implementation phases, strategic roadmaps, and process flows in sequential order. The diagram displays progress percentages at each stage, enabling stakeholders to quickly understand business advancement and milestone achievement at a glance.
-
How to Use
Input stage names, objectives, and metrics into each arrow node to represent your business promotion plan. Use in business strategy presentations, investor pitch meetings, executive briefings, and strategic planning sessions across fintech, finance, and technology sectors.
-
Recommended For
Ideal for fintech and financial services companies presenting business strategies, startup investor presentations, executive reports, and business planning meetings. Suitable for project managers, business strategists, and executives visualizing phased implementation plans.
-
Slide Structure
2-slide layout. First slide features a 4-stage linear arrow diagram with percentage progression (20%-40%-80%-100%). Second slide contains 3 information boxes (Value 01/02/03) for detailed explanations of each stage. 16:9 widescreen format, PPTX file type.
Related Products
-

Linear Diagram Slide for Business Service Differentiation Strategy
#Product/Service Introduction #Diagram #Graph
-

Visualizing Future Service Development Procedures – Strategies for Innovation
#Product/Service Introduction #Business Strategy #Diagram
-

Target Customer Strategy – Attractive Service Delivery Flow
#Product/Service Introduction #Marketing Plan and Strategy #Diagram
-

Pregnant Woman Diagram in Third Trimester – Business Direction Presentation
#Business Strategy #Diagram #Other
