Service Configuration Linear Diagram – Visualizing Service Operations
RJ0600009_12
- Last Update 06/23/2025
- File Size 4.9MB
- # of Slides 2
- File Format PPTX
- Slide Ratio 16:9
- Color
Keywords
- #Content-Based Slides
- #Design-Based Slides
- #Technical Approach
- #Diagram
- #Service Operation Plan
- #Service Implementation Plan
- #Flow
- #Cluster
- #Linear Flow
- #16:9
- #linear diagram PowerPoint
- #3-step process slide
- #service configuration diagram
- #process flow PPT template
- #business process visualization slide
About the Product
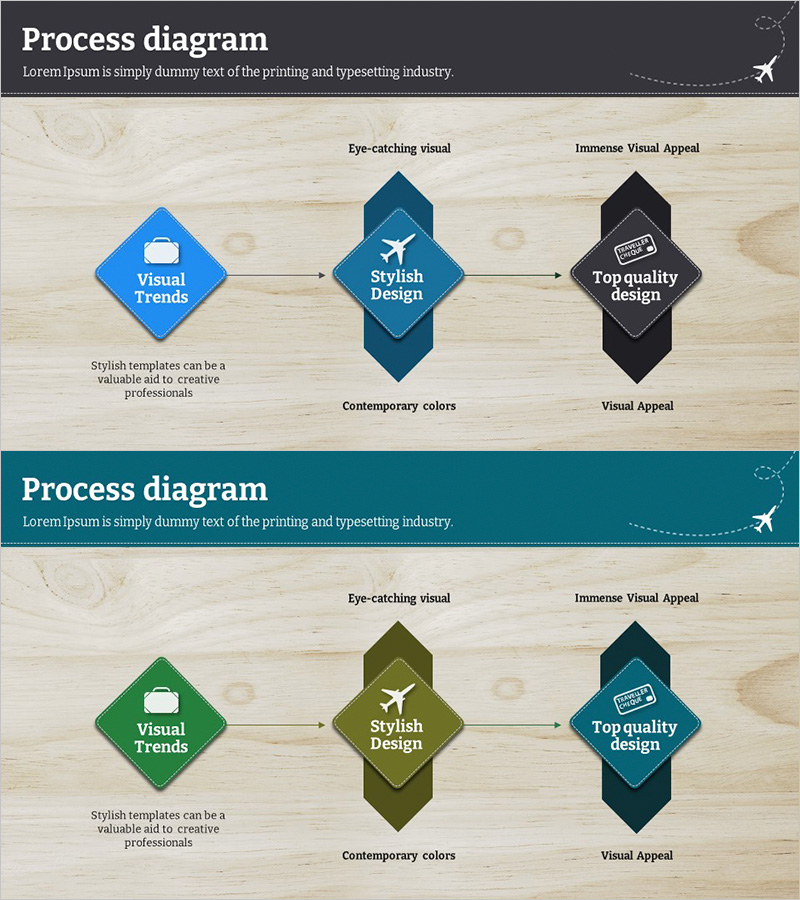
A PowerPoint slide that visualizes service operations and business processes through a 3-step linear flow diagram. The design features a blue diamond node on the left, a dark teal hexagon in the center, and a black hexagon on the right, connected by directional arrows. Each node includes an icon and text label for clear communication. Set against a light wood-grain background, this slide is ready for immediate use in presentations and business documents. The 2-slide set includes color variations (blue, green, and black palettes) that can be customized to match your corporate branding.
Usage Points
-
Main Usage
Clearly visualizes service operations, business workflows, and phased implementation strategies in a left-to-right linear progression. Each stage is represented with icons and text labels, enhancing audience comprehension and engagement.
-
How to Use
Ideal for company overview presentations (service introduction section), proposal documents (implementation approach), business plans (operational framework), and marketing presentations (campaign phases). Easily customize node text and icons to match your specific content and messaging.
-
Recommended For
Service companies, IT firms, consulting agencies, marketing teams, and product development departments presenting process explanations, strategy pitches, and client proposals. Recommended for any presentation requiring clear step-by-step progression and sequential information delivery.
-
Slide Structure
2-slide set. Each slide features 3 nodes (left diamond, center hexagon, right hexagon) connected by directional arrows in a linear flow. Slide 1 uses blue, dark teal, and black color palette; Slide 2 features green, olive, and teal variations. Wood-grain background and icon elements enhance visual appeal and professionalism.
Related Products
-

Automobile Management Service System – Efficient Operation Strategy
#Technical Approach #Diagram #Service Operation Plan
-

How to Measure Smart Health – Visualizing Effective Data Flow
#Operational Plan #Technical Approach #Diagram
-

Business Model Structure – Visualization of Service Operations
#Technical Approach #Diagram #Service Operation Plan
-

Elderly Care Service Stages – Business Strategy Diagram
#Business Strategy #Technical Approach #Diagram
