Visualizing Data with Current Status Area Graph
RJ0600008_11
- Last Update 06/22/2025
- File Size 0.1MB
- # of Slides 2
- File Format PPTX
- Slide Ratio 16:9
- Color
Keywords
About the Product
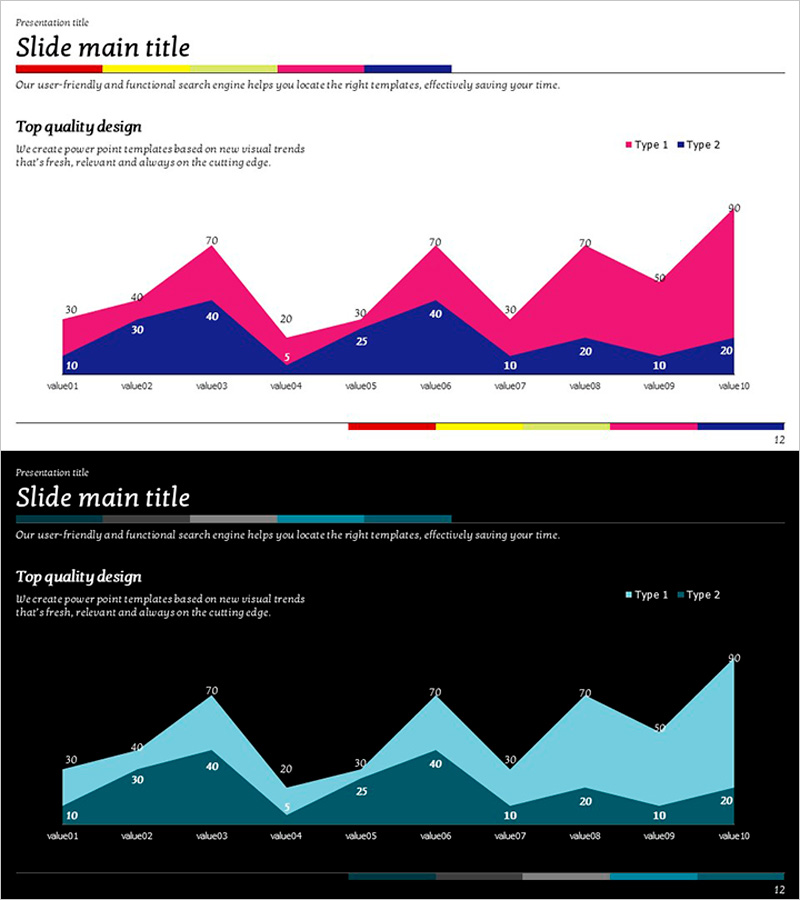
A PowerPoint slide that visualizes two data series using a stacked area chart design. The magenta and navy overlapping area structure clearly displays trends and comparisons between two datasets simultaneously. With 10 data points labeled with precise values, this slide effectively communicates changes over time in presentations and reports. The dual-area format is ideal for business reports, financial analysis, and performance presentations where comparative data visualization is essential.
Usage Points
-
Main Usage
Compare two or more data series across time periods using an overlapping area structure. This design simultaneously displays individual trends for each series and the combined total, making complex data relationships intuitive and easy to understand.
-
How to Use
Use in business status reports, market analysis presentations, and financial performance briefings to show quarterly or monthly comparative data. Numerical labels at each data point enable precise value explanation, while the color legend clearly distinguishes between the two series.
-
Recommended For
Marketing professionals, financial analysts, project managers, and executives presenting performance reports benefit from this template. It works especially well for revenue-vs-cost comparisons, actual-vs-target trends, departmental performance contrasts, and any scenario requiring comparative data analysis.
-
Slide Structure
Composed of two overlapping area series with magenta (Type 1) and navy (Type 2) areas. The horizontal axis displays 10 data points (value01 through value10), the vertical axis shows a 0–70 numerical scale, and each data point includes a precise value label for accuracy.
Related Products
-

Work Stress Visualized with Line Chart – Analysis and Competitive Advantage
#Market and Competitor Analysis #Graph #Market Status
-

Simple Car Wide Presentation Donut Chart - Perfect Template for Technical Introductions
#Product/Service Introduction #Business Introduction #Graph
-

Analysis of Consumer Usage Status – Market and Customer Trends
#Market and Competitor Analysis #Graph #Market Status
-

Bar Chart of Key Segments – Data Analysis and Performance Visualization
#Business Introduction #Graph #Horizontal Bar
