Patient Satisfaction Survey Results Pie Chart Slide – Market Status Analysis
RB0400010_6
- Last Update 03/12/2025
- File Size 0.3MB
- # of Slides 2
- File Format PPTX
- Slide Ratio 4:3
- Color
Keywords
- #Content-Based Slides
- #Design-Based Slides
- #Market and Competitor Analysis
- #Graph
- #Market Status
- #Customer Analysis
- #Circles
- #Pie Chart
- #4:3
- #pie chart PowerPoint slide
- #circular graph template
- #patient satisfaction survey
- #survey results analysis slide
- #3-segment ratio chart
- #healthcare data visualization
About the Product
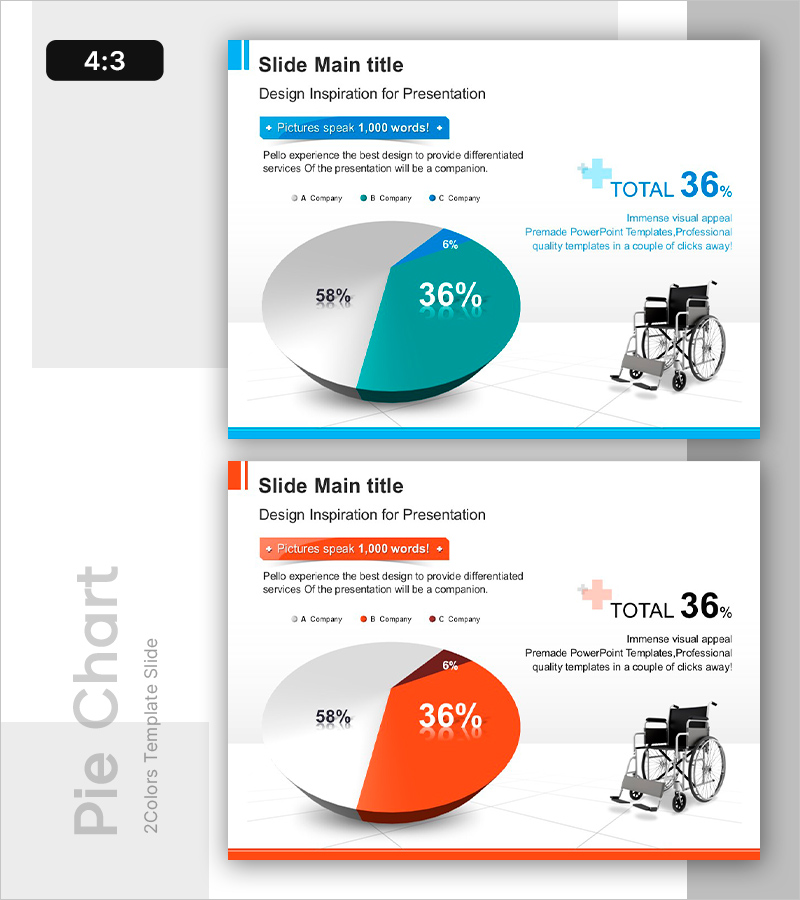
A PowerPoint slide featuring a 3-segment pie chart visualizing patient satisfaction survey results. The circular graph uses teal, gray, and orange color segments to clearly distinguish proportions, with a wheelchair icon and text area on the right for additional context. This 4:3 aspect ratio, 2-slide template is ready to use for healthcare organizations, hospitals, and medical companies presenting customer satisfaction analysis, market status reports, and survey findings in professional presentations.
Usage Points
-
Main Usage
Designed for healthcare organizations, hospitals, and medical companies to visualize patient satisfaction surveys, customer satisfaction analysis, and market status findings using pie charts in reports and presentations.
-
How to Use
Enter survey item names and percentage values into each pie chart segment, and add analysis insights or findings in the right-side text area. Colors and data values are fully editable and can be inserted directly into meetings, reports, and presentations.
-
Recommended For
Healthcare executives, hospital marketing teams, quality management departments, healthcare consultants, and pharmaceutical/medical device company sales and planning teams presenting customer satisfaction, market research, and business performance data.
-
Slide Structure
2-slide set with the first slide featuring a teal-emphasized pie chart (58% vs 36% vs 6% three-segment split) and the second slide showing an orange-emphasized pie chart. Each slide includes a wheelchair icon and text area on the right for adding explanations and insights.
Related Products
-

Eco-friendly Light Bulb Pie Chart – Market Share Analysis
#Market and Competitor Analysis #Graph #Market Status
-

Visualizing Market Share and Status with Pie Chart
#Market and Competitor Analysis #Graph #Market Status
-

Market Status and Share Analysis Slide – The Harmony of Blue and Orange
#Market and Competitor Analysis #Graph #Market Status
-

Market Status and Share Graph – Harmony of Blue and Orange
#Market and Competitor Analysis #Graph #Market Status
