Financial Analysis Charts & Tables – Change and Growth
RM0500002_7
- Last Update 02/20/2025
- File Size 1.1MB
- # of Slides 2
- File Format PPTX
- Slide Ratio 16:9
- Color
Keywords
About the Product
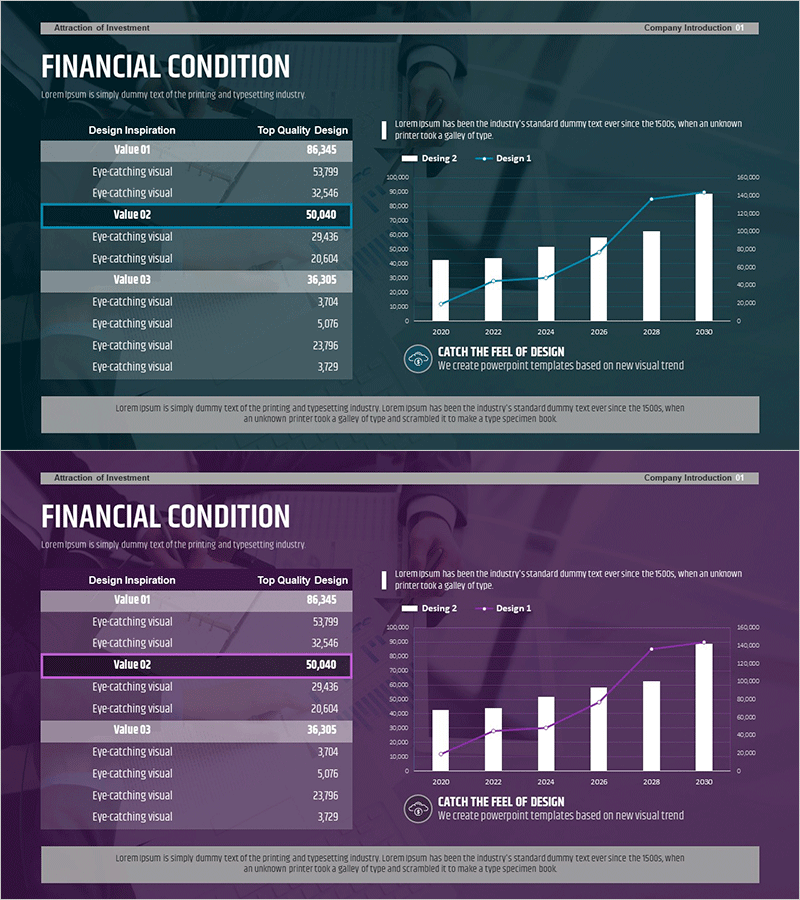
A comprehensive PowerPoint slide combining data tables and bar charts to present financial performance at a glance. The left side displays a structured table with design inspiration metrics and numerical values, while the right side features a vertical bar chart tracking year-over-year trends alongside a line graph showing growth trajectory. Available in two color schemes—dark blue and purple—both fully customizable to match your corporate branding. This slide deck is ready to use in business presentations, financial reports, investor pitches, and company performance reviews.
Usage Points
-
Main Usage
Present corporate financial status and growth trends simultaneously using a dual-format approach. The table provides precise numerical data while the bar and line charts deliver visual impact, making it ideal for communicating financial health and growth potential to investors, stakeholders, and employees.
-
How to Use
Insert this slide into business plans, investor presentations, quarterly earnings reports, and company performance decks in the financial section. Replace the sample data with your actual figures, adjust colors to match your brand guidelines, and customize the table labels and chart legends as needed.
-
Recommended For
CFOs, financial analysts, business development managers, and marketing professionals presenting financial metrics. Particularly effective for startup investor pitches, corporate earnings announcements, and investment proposals where growth trajectory is a key selling point.
-
Slide Structure
Two-slide set featuring identical layouts in different color schemes. Each slide contains a left-aligned data table (three value groups with 2–3 sub-metrics each) and a right-aligned dual-axis chart (vertical bar graph spanning five years plus overlay line graph for trend analysis). Dark blue and purple background versions provided separately.
Related Products
-

Presentation Slide Visualizing Company Performance with Column Chart
#Company Introduction #Market and Competitor Analysis #Diagram
-

Big Data Market Analysis Graph – Trends and Performance
#Market and Competitor Analysis #Financial Plans and Performance #Diagram
-

Visualizing Business Strategies with Tables & Charts – Clear Data Presentation
#Business Strategy #Financial Plans and Performance #Diagram
-

THE ROAD Presentation Table & Tied Vertical Bar Graph – Market and Competitor Analysis
#Market and Competitor Analysis #Diagram #Graph
